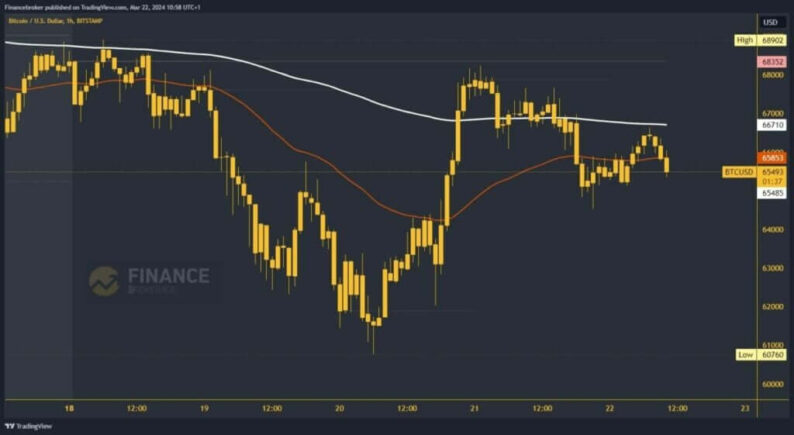
Bitcoin chart analysisYesterday’s Bitcoin price movement was in a bearish consolidation from $68300 to $64500. The price was under pressure from the EMA200 moving average in the zone around $67000, which further weighed on Bitcoin. After falling to a new low this morning, we saw a return above $65,000 and an attempt to recover.This morning’s bullish consolidation took the price up to the $66700 level, where we met the EMA200 again and failed to move above the bullish side again. We are now looking at a new negative consolidation and pullback below the $65500 level. We expect to retest yesterday’s support level soon.  Are we going to a new low or going back above $67000?New pressure on that level could push the price of Bitcoin below to a new two-day low and thus confirm the bearish trend. Potential lower targets are the $64,000 and $63,500 levels. With that step, we return to the previous support zone. Below, we would be very close and under pressure to test this week’s around $61000 level.We need to get back above $67000 and the EMA200 moving average for a bullish Bitcoin price option. Then we also need to maintain ourselves there above. If I succeed in this, it will be easier for us to start a positive consolidation from there and start further recovery. Potential higher targets are the $68,000 and $68,500 levels. We test the weekly open price at $68,350, and by moving above, we return to the bullish side.More By This Author:April 2024 Bitcoin Halving: A 50% Reward Cut LoomsBoJ’s Historic Rate Hike & ECB’s Cut Signals Shake EUR/JPYEthereum’s Fall Below $3,550: A Bearish Market Signal


Leave A Comment