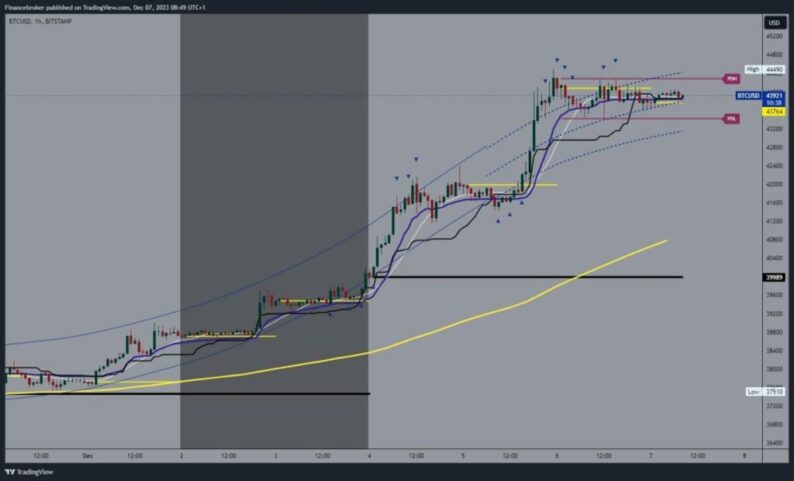
Bitcoin chart analysisThe price of Bitcoin was moving in a sideways channel in the $43400-$44300 range yesterday. Today, we see a continuation of that movement and are currently in the middle of the channel. Since we are still holding high, we expect to see a continuation to the bullish side and a break above the $44400 level. After that, the door opens for us to continue growing to higher levels.Potential higher targets are $44600 and $44800 levels. We need a negative consolidation and a drop to the $43400 support level for a bearish option. A pullback below leads to the formation of a new low and thus confirms the bearish presence on the chart. Potential lower targets are $43200 and $43000 levels.  Ethereum chart analysisThe price of Ethereum yesterday was in retreat from $2300 to $2220 level. Today, we see support at that level and the initiation of bullish consolidation and recovery up to the $2060 level. We could expect to see a continuation of this consolidation by the end of the day and get closer to the $2300 level again. If we manage to get closer, we will have the opportunity to make a breakthrough above and continue to the bullish side.Potential higher targets are $2320 and $2340 levels. We need a negative consolidation and a new pullback to the previous support at the $2220 level for a bearish option. A drop in the price of Ethereum below this support would lead to the formation of a two-day low, thus jeopardizing a potential further recovery. Lower targets are $2200 and $2180 levels, additional support at the lower level is the EMA50 moving average.
 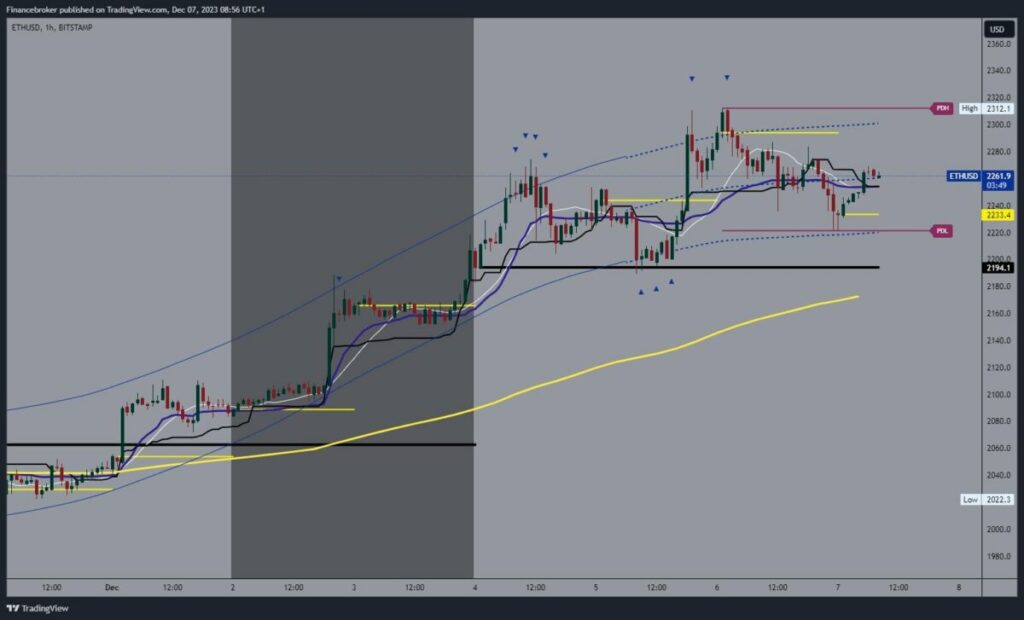 More By This Author:Dogecoin Retreats To 0.09600 And Shiba Inu To 0.00000960OPEC+ Skepticism Causes Trading Crude Oil SlideSolana Crosses Above 66.00, And Cardano Above 0.430 Level


Leave A Comment