The start of a new year always brings a deluge of tips from Wall Street analysts trying to pick the winners for the year ahead.
Bank of America’s team of quant strategists, led by Savita Subramanian believe that the best strategy, based on past results, is to avoid the most crowded stocks and increase exposure to underweight equities.
According to a recent report on the topic, since 2009 the ten most overweight stocks have lagged the ten most underweight stocks on average by 57 basis points and 117 bps during the first 15 and 30 calendar days of the year, respectively.
Short Crowded Stocks To Generate Alpha
Towards the end of last year, this trade reportedly started to play out. In the two weeks after November 27, neglected stocks outperformed crowded stocks by almost a full percentage point over the next two weeks according to BoA’s analysis. However, this spread was subsequently wiped out ahead of December 31, “suggesting that crowding risks may remain ahead of the tendency for asset allocators and PMs to rebalance after year-end.”

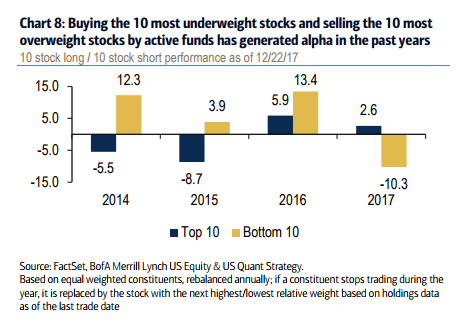
2017 was the first year since 2009 where the trends noted above have not held true. This could be a result of the increasing influence of passive funds on the market.
BoA’s figures highlight that by the end of 2017, passive funds accounted for 38% of US domiciled fund assets under management, up from less than 20% in 2009. Meanwhile, the percentage of active AUM has declined to 62% from more than 80% following the financial crisis. In every year, bar 2013, passive funds have attracted more assets than passive since 2009.

It seems that as active managers have tried to compete with their lower cost rivals, they’ve shifted away from trying to find undervalued small caps, favoring instead chasing large-cap growth:
“2017 was the first year in our data history that large-cap managers favored stocks with larger market caps. The average market cap of fund holdings today is $189mn vs. $179mn for the S&P 500 index. Fund managers also increased their bias towards higher Growth stocks, with holdings’ average long-term growth rates at 14% vs. 12% for the S&P 500 index. Both factors likely aided performance in 2017: the Russell 1000 outperformed the Russell 2000 by 7ppt, and Growth outperformed Value by 17ppt.”

Related Posts
 Indian Gold Premiums Explode After Nation’s Biggest Gold Importer Suspends Bullion Dealers Accounts
 Markozy, Merde, And Now Meron
 Most Active Equity Options And Strikes For Midday – Monday, April 16
 JPEX blames partners for ‘maliciously’ freezing funds, causing liquidity crisis
- ‘Tracers in the Dark’ presents a fun crime story — and lesson in privacy
 The Big Four Economic Indicators: Real Personal Income In September


Leave A Comment