There are two ways that corporations can return capital to shareholders:
Adding these two capital return methods together on a per-share basis and dividing by a company’s current stock price gives shareholder yield, a proxy for the ‘shareholder-friendliness‘ of a company’s management team.
Dividend payments are straightforward and well understood by most investors. Conversely, share repurchases are a very misunderstood tool used by companies to return cash to shareholders.
This is particularly unfortunate because share repurchases are actually much more tax efficient than dividend payments. Dividend payments are subject to double taxation (tax on corporate net income, then tax on personal dividends), while share repurchases are only taxed once.
Share repurchase also have a greater long-term effect on corporate net worth, since any dividends that would be paid on repurchased common shares are eliminated, resulting in meaningful cost savings in the long run.
With all this in mind, it’s clear that share repurchases can have a profound effect on long-term shareholder returns.
In recent years, there is perhaps no greater example of a successful share repurchase program than Apple’s (AAPL ) ongoing capital return program.
Apple’s buyback is magnificent in both magnitude and execution. The company’s management team has repurchased stock at persistently low valuations, often financing the purchases using attractively-priced debt to be repaid later using the company’s robust free cash flow.
Apple’s repurchase plan has been very well done and provides an insightful case study into corporate governance and capital allocation.
This article will analyze Apple’s capital return program in detail.
A Quantitative Summary
Apple’s current capital return program was initiated in 2013.
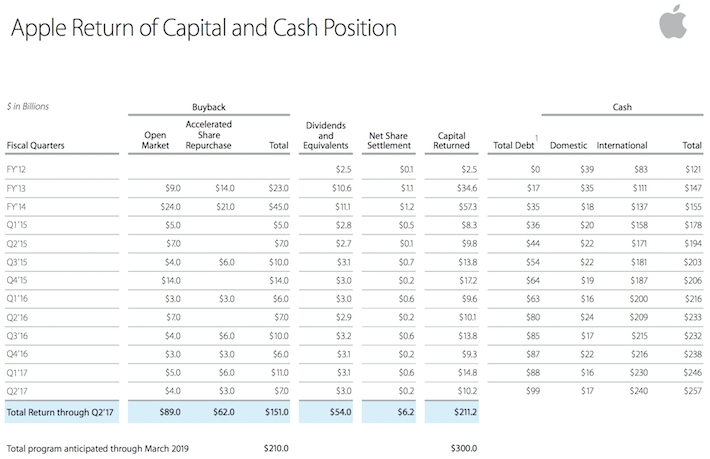
To date, the company has returned $211 billion of capital to shareholders through a combination of dividend payments and share repurchases. During this time, the company’s cash account has grown from $121 billion to $257 billion.
The following table provides a detailed breakdown of the magnitude and composition of Apple’s capital return program by reporting period.

Source: Apple Investor Relations
There are a number of remarkable observations that can be made from this table.
First of all, Apple’s current share repurchase program has already driven the company to repurchase $151 billion of the company’s current stock outstanding.
For context, Apple has a current market capitalization of $768 billion, which implies that Apple has already spent approximately 20% of its current market cap on share repurchases.
In reality, the effect on Apple’s outstanding share count would be materially higher than 20% because many of the repurchased shares were purchased at prices significantly lower than Apple’s current stock price.
For instance, consider the following breakdown of Apple’s fiscal 2016 share repurchases by time period:

Source: Apple 2016 10-K, page 19
During the three time periods shown above, Apple’s average price paid per share was $96.83, $108.11, and $109.71. The company’s current stock price is ~$149 and it has been as high as $155 recently, which means that the ‘return’ on these repurchased shares has been significant.
Another impressive metric shown in the first table is the sheer amount that Apple has paid in dividends – $54 billion to date. At current market prices, this amounts to approximately 7% of the company’s market capitalization.
Other than the dollar value of repurchased shares and dividends paid, there are two other metrics we can use to appreciate the impressive magnitude of Apple’s share repurchase program.
The first is the change in Apple’s share count over time. This can be seen below.

Source: YCharts
In the above chart, you can see a deliberate shift in Apple’s balance sheet management strategy. Until 2011, Apple’s share count was regularly expanding, although usually by low-single-digit percentages.
Once 2013 hit and Apple’s free cash flow built its cash account to prohibitive levels, the company began focusing on reducing its share count and returning capital to shareholders.
Another metric to consider is the growth differential between Apple’s company-wide net income and its earnings-per-share. When a company is actively repurchasing shares, earnings-per-share growth will outpace company-wide net income growth because shares outstanding (the denominator in earnings-per-share) is decreasing.


Leave A Comment