Today affirmed for me once again the wisdom (for me, at least) of having a zillion little equity positions instead of one or two huge ones. To explain: before the opening bell, the ES was down good and hard, and I figured (with my 128 short positions) it would be a good day. It started off that way, but then, for absolutely no reason whatsoever, the market strengthened at once, and my beautiful profit had eroded into a small loss as the ES turned a disgusting shade of green.
Then, just as easily, the market started eroding, and by the end of the day, I had a big honkin’ profit (and had padded my portfolio with even more positions, ending with 135). I am highly confident that I would have freaked out early on if I had just one huge SPY short position, and I would have probably exited at the worst possible moment. As it was, I covered virtually nothing, and the day ended up great. So………take that, morning bulls.
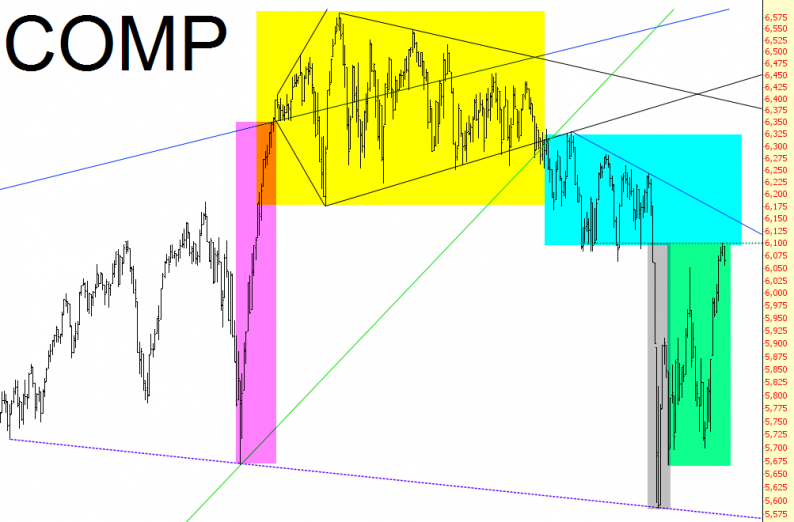
I think my portfolio, stated above, says more about my disposition on the market than just about anything, but I at least wanted to drag out our old friend the Dow Jones Composite to take another look at what I consider its core patterns of movement over the past couple years.

(a) the magenta portion represents the last, sickening lurch higher than the bulls enjoyed, spurred on by that Fed turd James Bullard. It remained a market of never-ending higher highs;
(b) the yellow is the Ichthus pattern I wrote about endlessly, only because the pattern seemed to go on endlessly. That was a tortuously long spell for the market to be in a very tight range, as we all waited for it to do something;
(c) the cyan marks the stage where the Ichthus at long last broke down and formed a right triangle. It was again a waiting game (although not as long as for the prior pattern);
(d) the grey was “the crash” (as crashes go, a fairly pathetic one, but it’ll do, pig, it’ll do), which bottomed on the early morning of Monday, August 24th.


Leave A Comment