BTC/USD
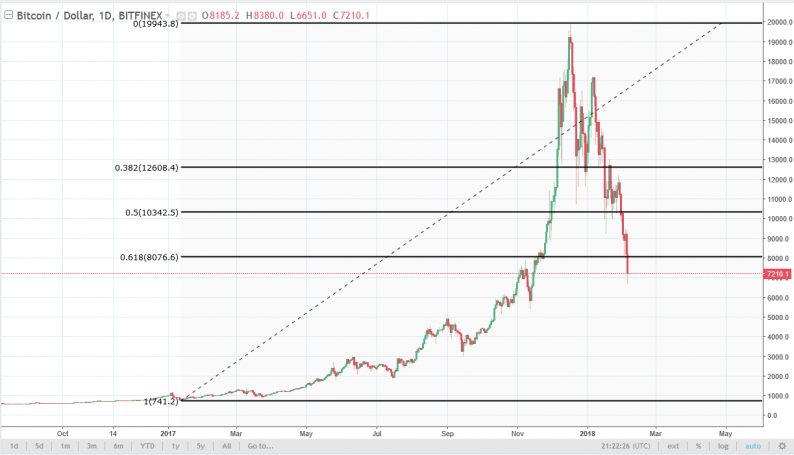
If I was to draw a chart of a bubble popping, the BTC/USD pair is a prime example. During the session on Monday, we broke the 8000 level and briefly broke the 7000 level. The 8000 level was important to me, mainly because it was a 61.8% Fibonacci retracement level, and I have found that if you stay below that level for any significant amount of time, you typically will wipe out most, if not all the entire move. In other words, I would not be surprised at all to see more selling. Furthermore, the market has broken down through the $8000 level on heavy volume, and if you look at the chart, and if you have been paying attention to my analysis, I have pointed out that the heaviest volume days are all negative. I think that continues to be the case. That’s not to say that we won’t get some type of significant bounce, we are most certainly will. However, that’s can be a nice selling opportunity.

BTC/JPY
Bitcoin markets look even worse against the Japanese yen, and we are now below the ¥800,000 level. At this point, I don’t see anything keeping this market from breaking down to the ¥600,000 level, but I would also anticipate that we could get a rally over here as well. I think ultimately if Bitcoin was to ever recover, it needs to do so against the Japanese yen more than any other currency, as Japan is such a large market for Bitcoin. I suspect that the market is one that is going to be damaged for some time, and retail traders have suffered at the hands of the bubble popping. Furthermore, the Japanese retail trader typically is highly levered, so although this chart looks bad, the damage to the Japanese trader is much more significant than it appears.


Leave A Comment