
 Freepik Bullish view
Bearish view
Bitcoin price continued its spectacular comeback as demand from retail and institutional investors continued. The BTC/USD jumped to a multi-month high of 37,986 last week as the greed among investors rose. It has jumped by almost 50% from the lowest point in September. FOMO continuesBitcoin and other cryptocurrencies have been in a strong uptrend in the past few months. This rally accelerated last week after Blackrock announced plans for a new Ethereum Exchange Traded Fund (ETF).This rally has attracted both institutions and retail traders. Institutions like MicroStrategy have continued adding positions. The company recently added more coins to its huge holdings. It now holds 158k Bitcoins, which are now valued at over $5.7 billion. This means that the company has had over $1 billion in unrealized profits.Another report by Byte Tree showed that investment trusts holdings of Bitcoin has jumped to over 863k, the highest point since April 2022. Inflows in funds like the Grayscale Bitcoin Trust have been rising.Bitcoin’s rally has pushed the crypto fear and greed index higher. The index, which looks at several gauges, has risen to the greed zone of 77. In most periods, Bitcoin tends to do well when there is elevated greed in the market.Further, BTC has risen as investors assess the next actions by the Federal Reserve. In its meeting this month, the Fed decided to leave rates unchanged between 5.25% and 5.50%. Most analysts now believe that the bank will maintain rates in this range for a while.Looking ahead, the US will publish the latest Consumer Price Index (CPI) data on Tuesday. These numbers are important because they usually impact the actions of the Fed. A deeper dip of inflation, coupled with the disappointing US Non-Farm Payrolls (NFP), means that the Fed will likely leave rates unchanged in December. BTC/USD technical analysisThe BTC/USD pair has been in a bullish trend in the past few months. On the 4H chart, the pair reached a high of 37,986 last week, the highest point since April last year. It has moved above the ascending channel, which is shown in red.Bitcoin has remained above the 25-period and 50-period Exponential Moving Averages (EMA). It has also formed a bullish flag pattern, which is usually a bullish sign. The Relative Strength Index (RSI) has moved below the overbought point.Therefore, the outlook for the pair is bullish, with the next level to watch being the psychological level at 39,000.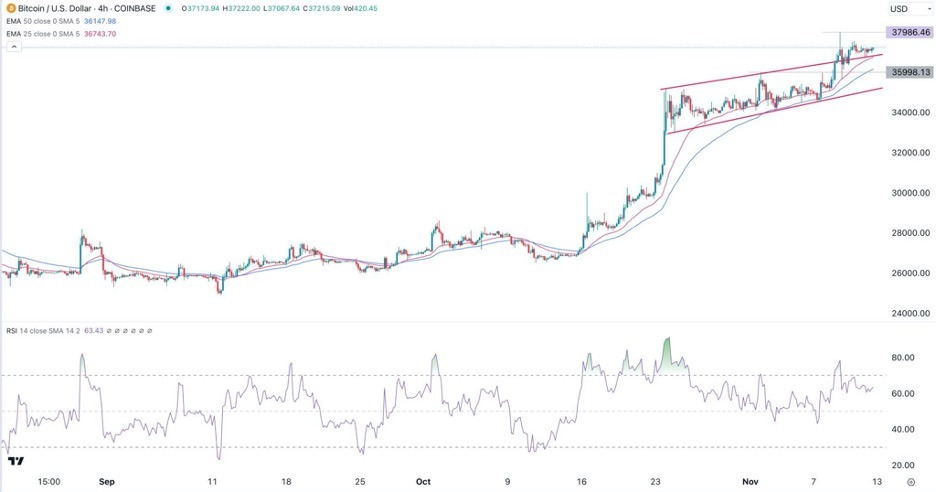 More By This Author:Weekly Forex Forecast – Sunday, Nov. 12Trading Support And Resistance – Sunday, Nov. 12, 2023GBP/USD Forex Signal: Forecast As Crude Oil Price Dips


Leave A Comment