Yesterday’s signals were not triggered, as none of the key levels were reached.
Today’s BTC/USD Signals
Risk 1.00% per trade.
Trades may only be entered before 5pm New York time today.
Long Trades
The best method to identify a classic “price action reversal” is for an hourly candle to close, such as a pin bar, a doji, an outside or even just an engulfing candle with a higher close. You can exploit these levels or zones by watching the price action that occurs at the given levels.
BTC/USD Analysis
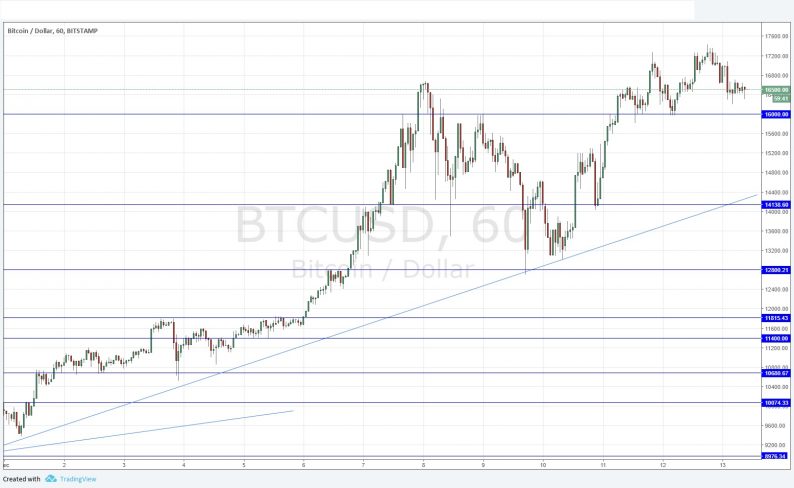
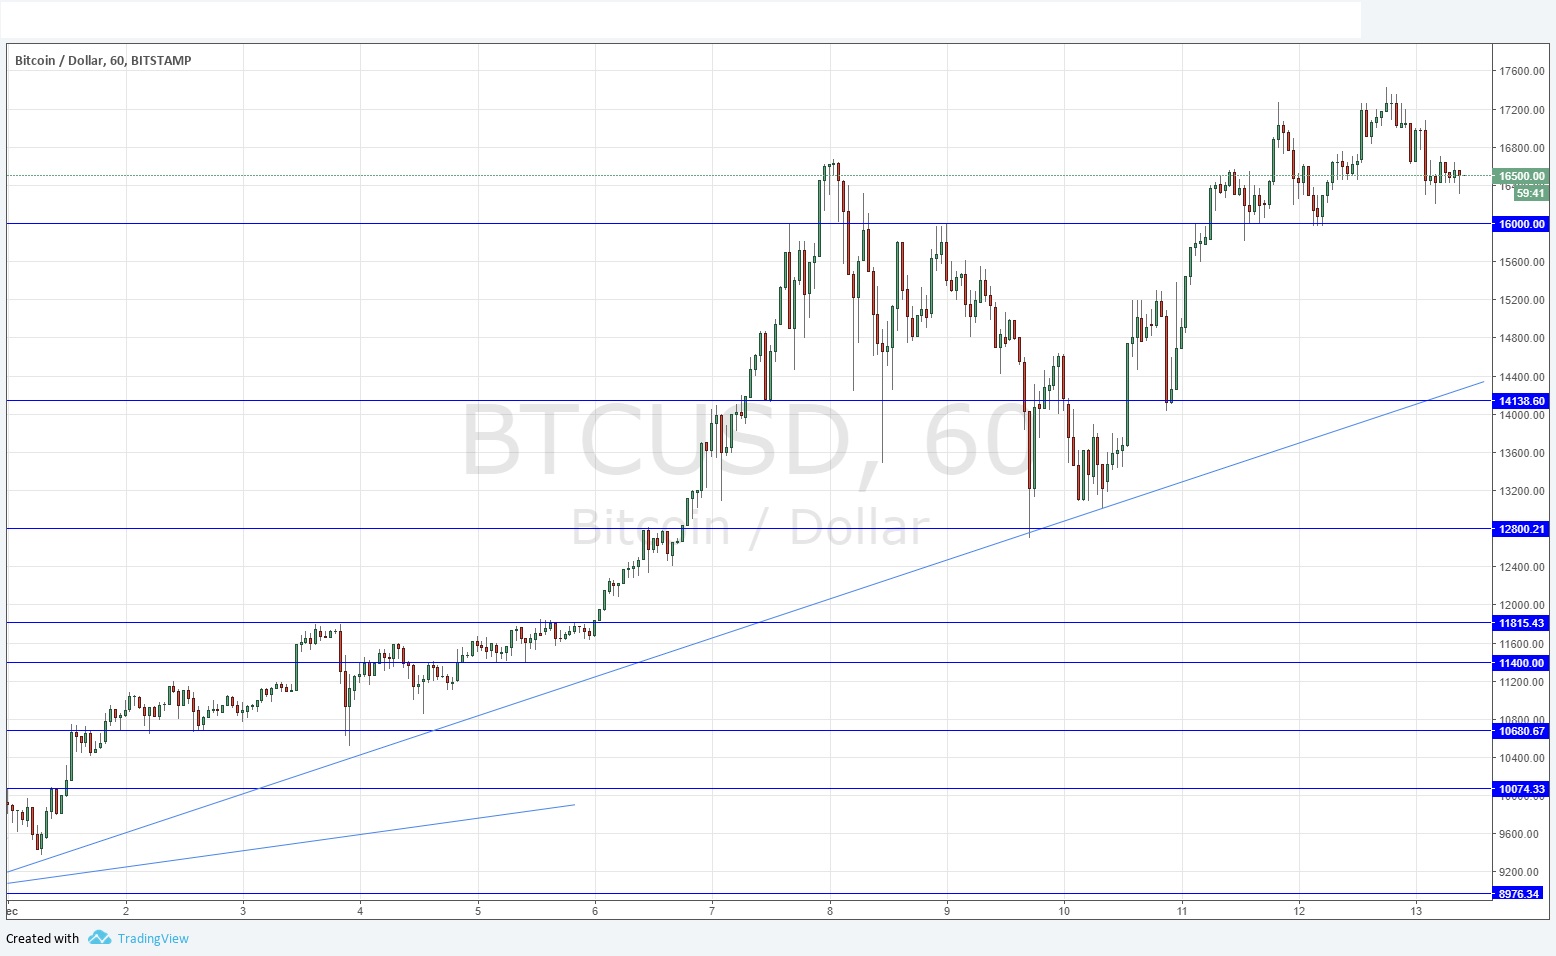
I wrote yesterday that bulls should be cautious in the event of a failure at an all-time high price. Such a failure happened yesterday, as the previous swing high at $17,279 was barely exceeded before the price turned bearish. However, this is not really a bearish sign yet as the nearest support level at $16,000 is still holding: in fact, it has not even been touched yet.
The picture is still bullish, but if the price retraces to $16,000 and breaks below the level without an immediate rebound, a fall to about $15,000 or even lower, to the area of support at around $14,200 which is currently confluent with a major supportive trend line, would become likely.
I have a bullish bias, but I note the slowing pace of the rise. Bulls should be cautious when the price reaches the all-time high, $17,500, or $20,000.


Leave A Comment