Cryptocurrencies have turned quiet for a change, demonstrating the lowest volatility since early 2017. The calm is not necessarily bad for bulls, as Bitcoin trades above $6,600. What’s next? The digital coin is well supported and may be ready for the next leg higher.
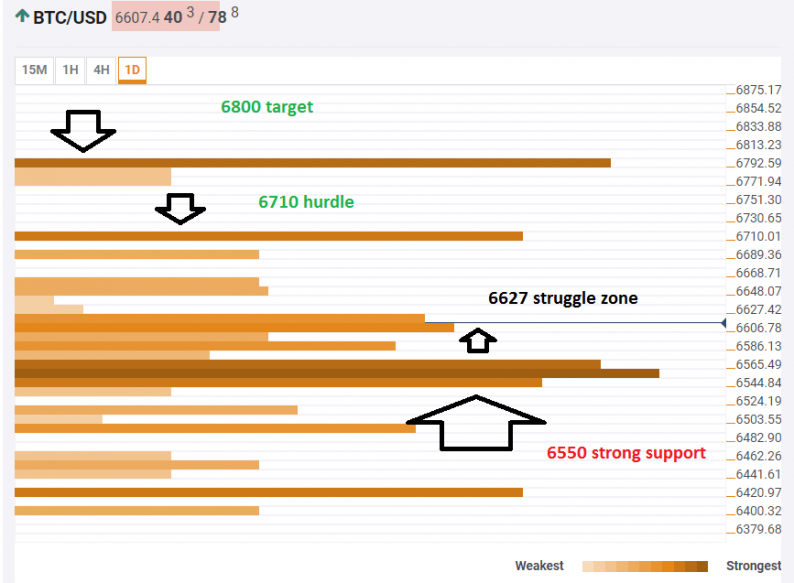
The Technical Confluence Indicator shows that the BTC/USD is currently trading amid a significant cluster of levels around $6,627. The list includes the Pivot Point one-day Resistance 1, the Simple Moving Average 5-one-hour, the SMA 50-1d, the Bollinger Band 15m-Middle, the Bollinger Band 4h-Upper, and the Fibonacci 38.2% one-month.
If Bitcoin breaks higher, it faces a hurdle at $6,710 where we see the Pivot Point one-day R3. The target is $6,800 which is the confluence of the Pivot Point one-week Resistance 2, last month’s high, the SMA 100-one-day, and the BB 1d-Upper.
Looking down, there is very strong support at $6,550 which is a dense cluster consisting of the Fibonacci 38.2% one-week, the SMA 200-15m, the SMA 50-1h, the SMA 100-1h, the Fibonacci 38.2% one-day, the BB 4h-Middle, the BB 1d-Middle, the SMA 10-4h, the SMA 10-1d, the SMA 100-15m, the SMA 100-4h, the SMA 50-4h, the SMA 5-1d, the SMA 200-1h, and the Fibonacci 61.8% one-day. It would take substantial downside momentum to see Bitcoin break down below this level.
Here is how it looks on the tool:

The Confluence Detector finds exciting opportunities using Technical Confluences. The TC is a tool to locate and point out those price levels where there is a congestion of indicators, moving averages, Fibonacci levels, Pivot Points, etc. Knowing where these congestion points are located is very useful for the trader, and can be used as a basis for different strategies.


Leave A Comment