
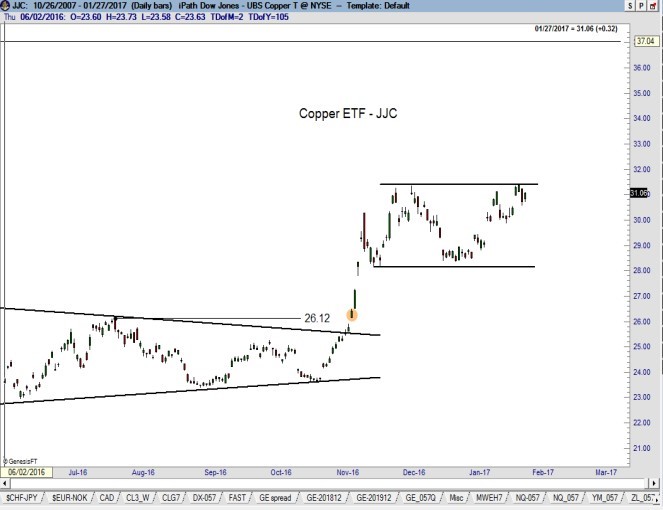
Copper
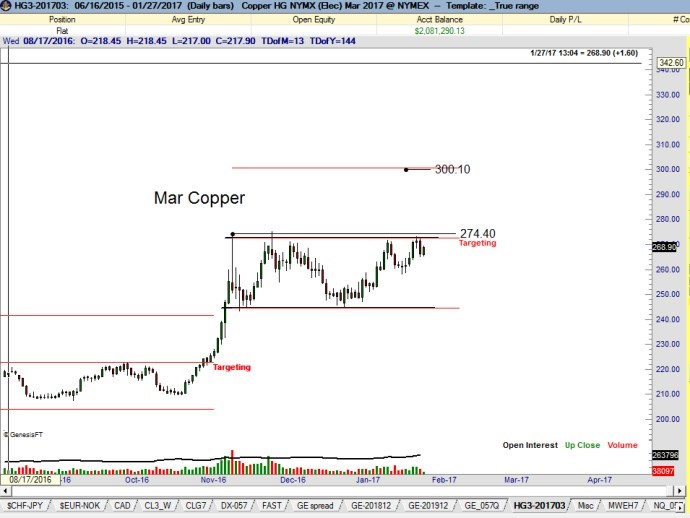
The daily and weekly charts of Copper appear to be forming an 11-week rectangle or ascending triangle, depending on how the boundary lines are drawn. A move and close above 274.40 would complete this consolidation pattern and establish an upside profit target of 300.
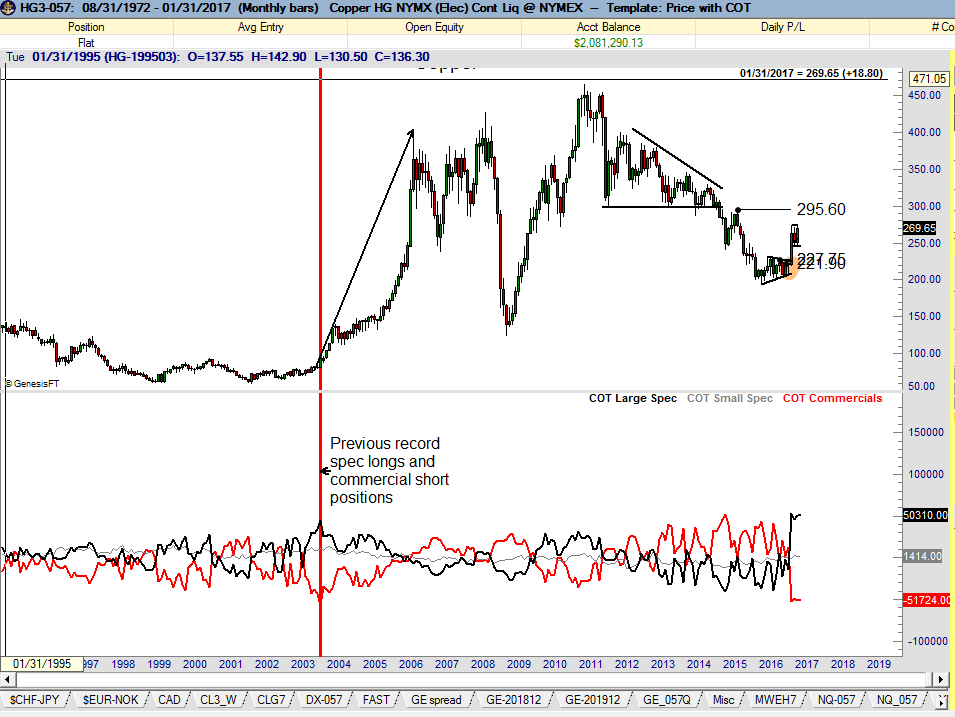
I am willing to buy the breakout in Copper, but with a huge caveat. The market is coming off a period of all-time record spec long and commercial short positions (by a massive margin compared to the previous records). Normally I would shy away from buying a market with this COT profile. Yet, as I have pointed out elsewhere in this Update, there have been rare occasions when a market is resolved in the direction of a record spec long COT profile. In fact, the most outstanding example of capitulation by commercial interests occurred in Copper in Oct 2003 – the period with the previous spec long and commercial short record holdings (see red vertical line on the monthly chart, next page). In that case the market went straight up for 2½ years with prices quadrupling. Usually commercial interests are right – but when they are wrong, they are dead wrong.


Leave A Comment