
Amazon (AMZN) has long been a favorite of traders and investors for many good reasons. And Amazon may have benefited by Apple’s falling out of favor with growth investors as well. After struggling in 2014 the stock gained 114% in 2015 after some upside EPS surprises. And if we take a look at the chart patterns it seems to suggest that price could indeed move above $1000 during it’s next run up.
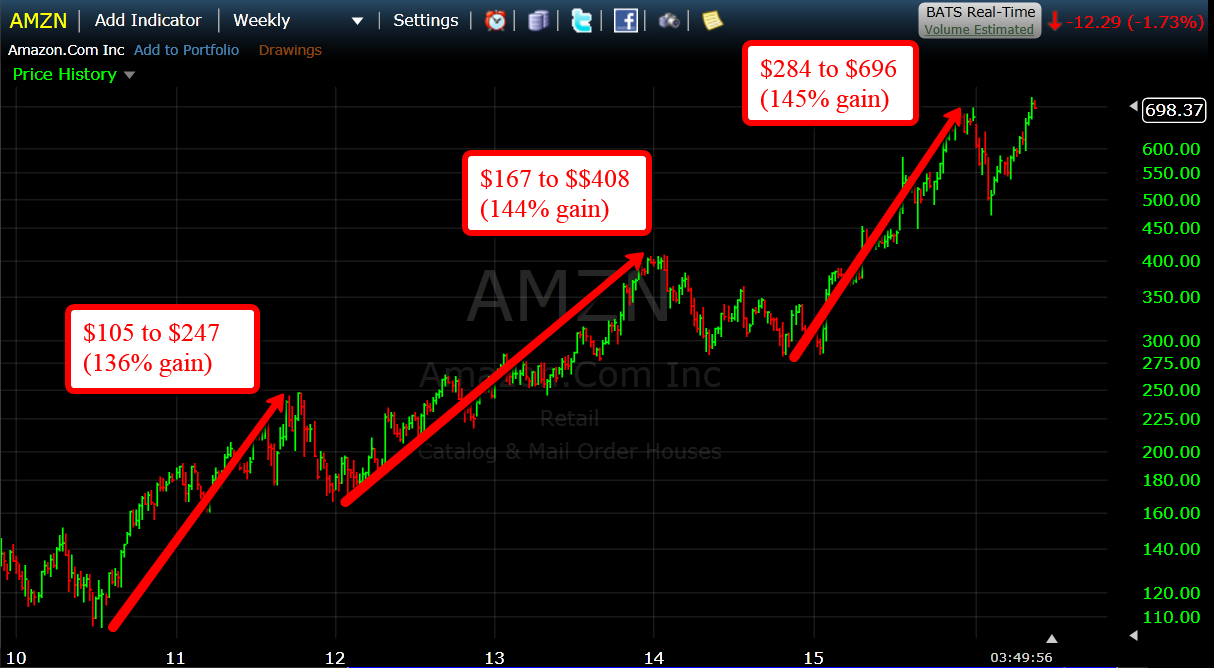
The chart above shows the price movements over the last 5+ years. It’s actually been quite amazing to see the continuity of these price moves. The three major rallies on the weekly chart have taken price up by 136-145% each time…
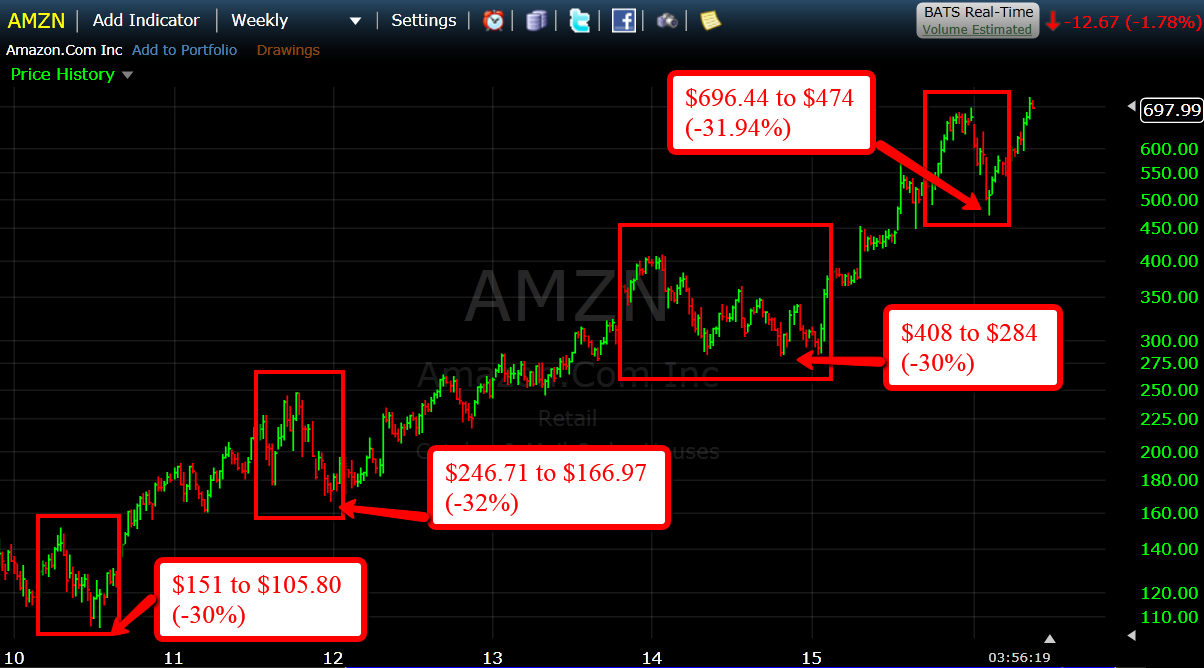
…even the declines have all been in the 30% range as well. This shows that even though Amazon has been a solid performer, it’s not immune to some major volatility at times.
During the 1st quarter 2016 macro market sell off, Amazon once again declined 30% off its all time high before finding support in the $475 range, along with the S&P 500.
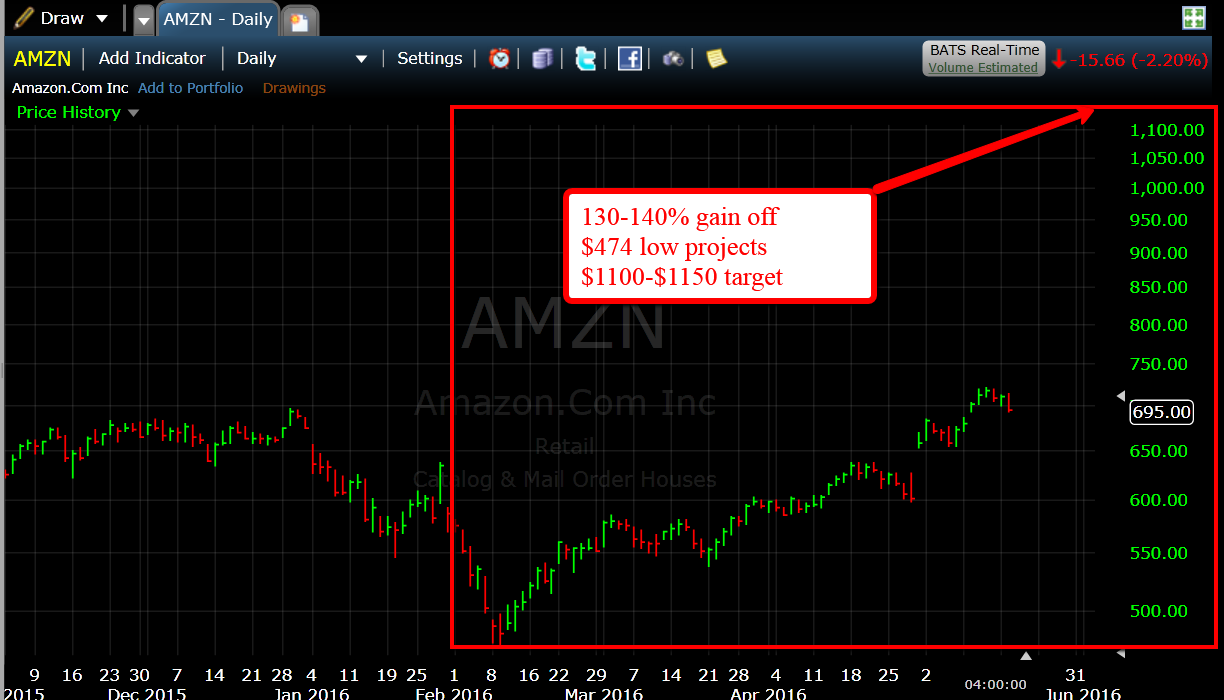
Recently Amazon made another all time high which would suggest that the $475 low is in place. Assuming this pattern continues (of which there is no guarantee) that would project an $1100 – $1500 price target for Amazon in the near future. That equates to about 50-60% upside from current levels.
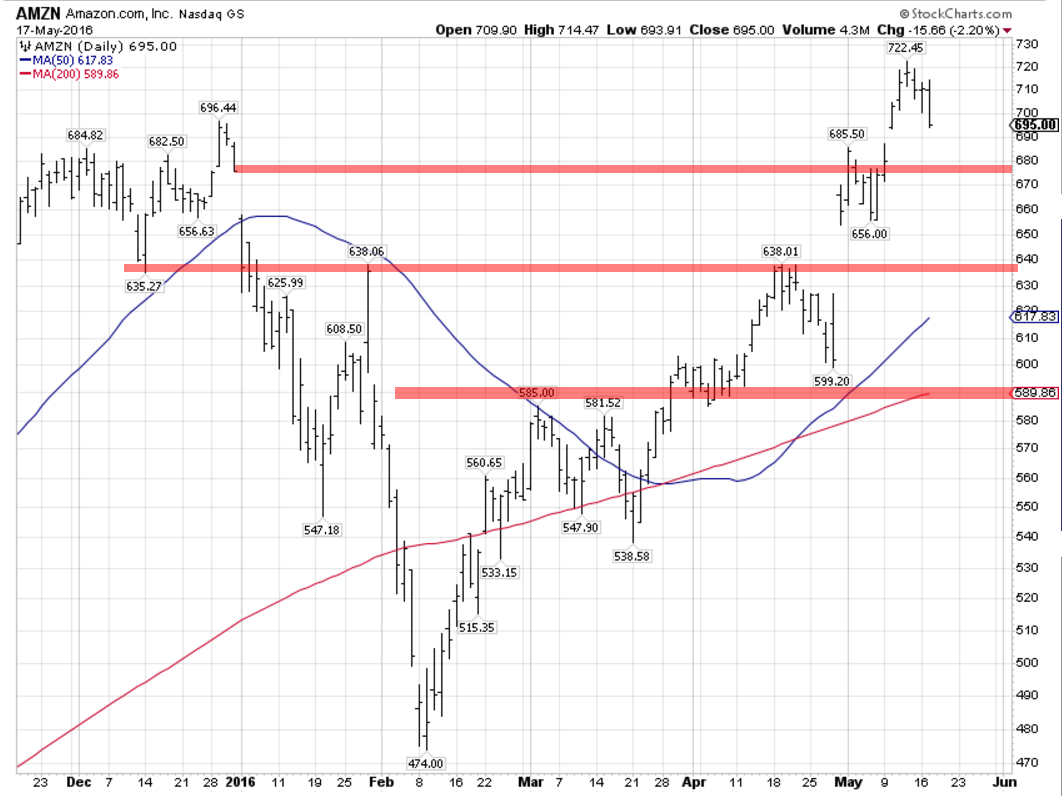
However as the old adage goes, “You can buy a good company at a bad price and it can still turn into a bad investment/trade”. It’s usually not a great idea to buy any stock or asset class at all time highs. Potential support zones are highlighted in the above chart.
Now in terms of the micro correction patterns in the stock, I don’t see any obvious symmetry there. The average correction (apart form the major 30% corrections) is approximately 11% with a range of 7.94% to 22.32%.
The first price level I would look at is $675, this would match the size of the prior two corrections since the $475 low ($40-$45 point drops) and coincides with the break even level for 2016.


Leave A Comment