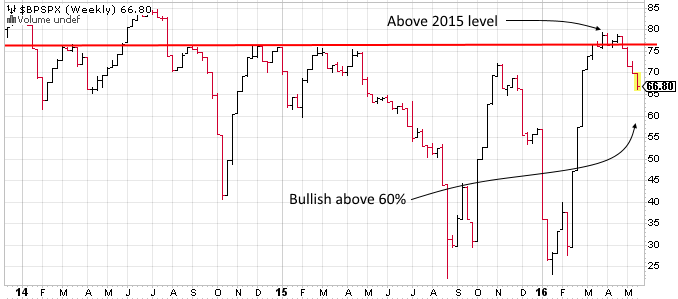
The rally out of the February lows has repaired a lot of charts. If you look at the bullish percent index (BPSPX) the last rally brought the percent of bullish point and figure charts in the S&P 500 Index (SPX) to nearly 80%. That level is higher than BPSPX achieved during all of 2015. This is an encouraging sign for the market as a whole because it gives BPSPX plenty of room to consolidate before getting below the 60% level. Long time readers know that I use readings below the 60% level to indicate increased risk (big market declines occur when breadth is already weak). So as long as BPSPX stays above 60% this indicator will remain bullish.

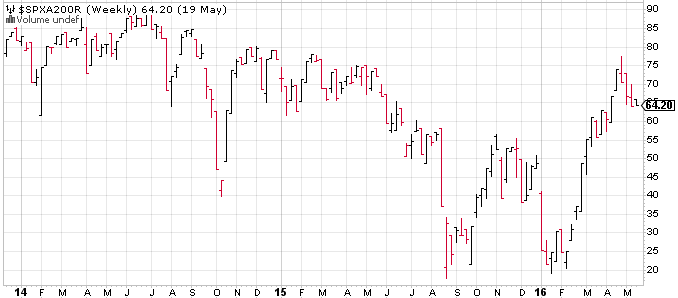
Another indication of chart repair comes from the percent of stocks in SPX that are above their 200 day moving average. This indicator is back to the 2015 level again. It has also improved substantially from the levels of the August 2015 to November 2015 rally (which had price peaking above the current rally).
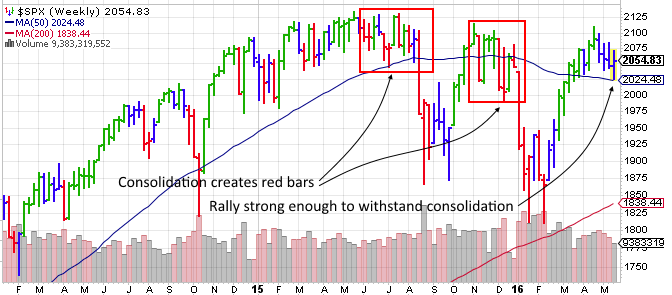
Elder Impulse on a weekly SPX chart is showing relative strength against the last two consolidation periods. Back of the napkin math would add a red bar below about 2040 on SPX so as long as the market can stay above that level it adds another bullish check box to the mix.
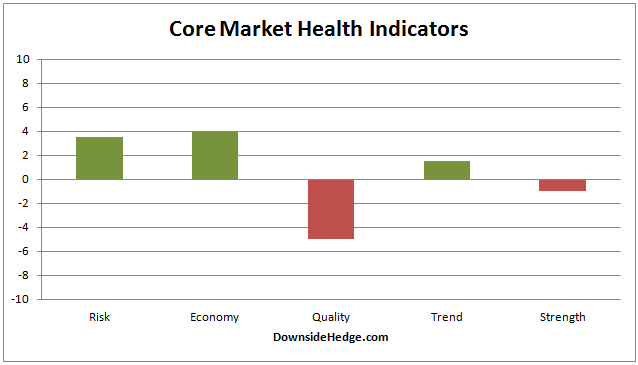
Last, but not least, all of my core market health indicators improved this week. This is an encouraging sign given the choppy trading this past week. One thing of note is my core measures of market strength will likely go positive next week if the market doesn’t decline a lot. My measures of market quality are improving fairly rapidly too so a rally next week may bring it positive as well.
Conclusion
Charts are being repaired. This helps strengthen the foundation of the market, which reduces risk and increases the odds of a sustained rally in the future. Keep and eye on BPSPX and the percent of stocks above their 200 dma. If they can stay above 60% it suggests the market is building the foundation for the next rally.


Leave A Comment