
Ahead of this afternoon’s FOMC expected rate hike announcement, the major US equity indices are in a bit of a holding pattern awaiting the next potential catalyst. With the pause in the action, we thought it would be a good time to provide an update on where the major US equity indices currently stand.
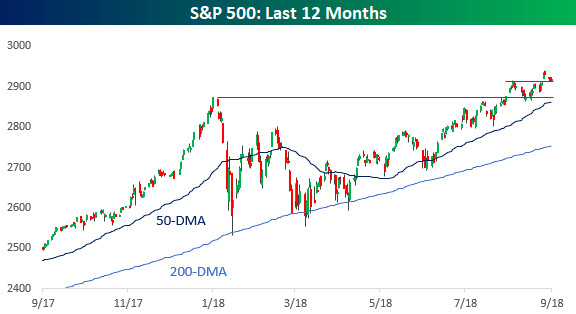
As far as the broad US market goes, the S&P 500 continues to trend higher. The breakout in late August was followed by a textbook test of support at the prior highs and then a subsequent rally to new highs. This week, we’re seeing what could be another mini-iteration of that process as the S&P 500’s new high last week is being followed up with a pullback that looks to be trying to find support at the late August highs.
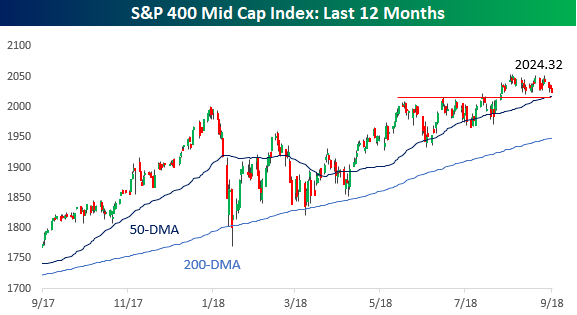
Moving down the market cap scale, mid-caps also broke out to new highs in late August and ever since have been in a consolidation mode trading in a sideways pattern comfortably above the Summer highs. As long as those highs from the Summer continue to act as support, mid-caps appear to be in good health.
Small caps are a similar picture as mid-caps, although they don’t look quite as positive due to the impacts of the weak dollar on the space. As we type, the Russell 2000 is testing support at the former highs from the Summer, and any break below they level could pose a problem for small caps.

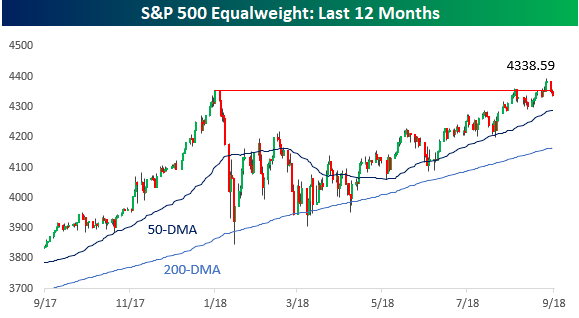
Unlike the market cap weighted index, which first broke out in late August, the equal-weighted S&P 500 didn’t convincingly break out until last week. This week, we’ve seen a bit of a pullback from those highs to the point where the equal-weighted S&P 500 is testing support at its former highs. While the chart for the equal-weighted S&P 500 looks positive, it isn’t quite as strong as the cap-weighted index.
Moving on over to the Nasdaq, it’s path has been a bit different than the S&P 500. After it’s breakout to new highs in late August, the Nasdaq hasn’t made a new high since, but it has also held support on three different occasions since then. As long as this support level (which also correspond to the 50-DMA) holds, the Nasdaq’s chart also looks healthy.


Leave A Comment