When titans clash, reverberations are felt around the world. The US central bank has begun a titanic clash with the US government, and as the battle unfolds, all markets will be impacted significantly.

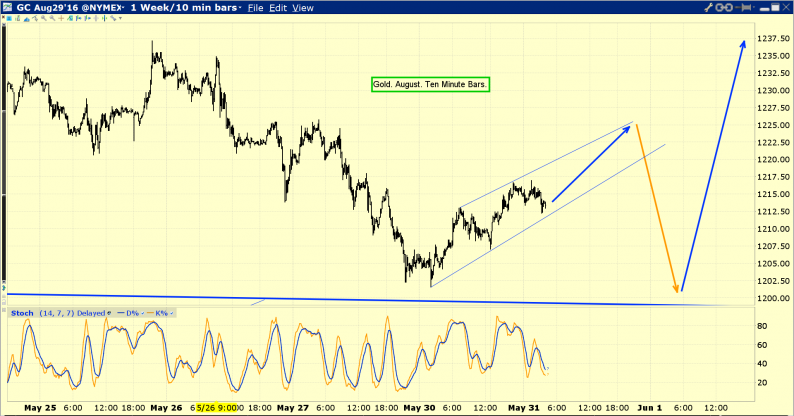
This short term chart shows gold beginning a small uptrend, with higher lows and higher highs.

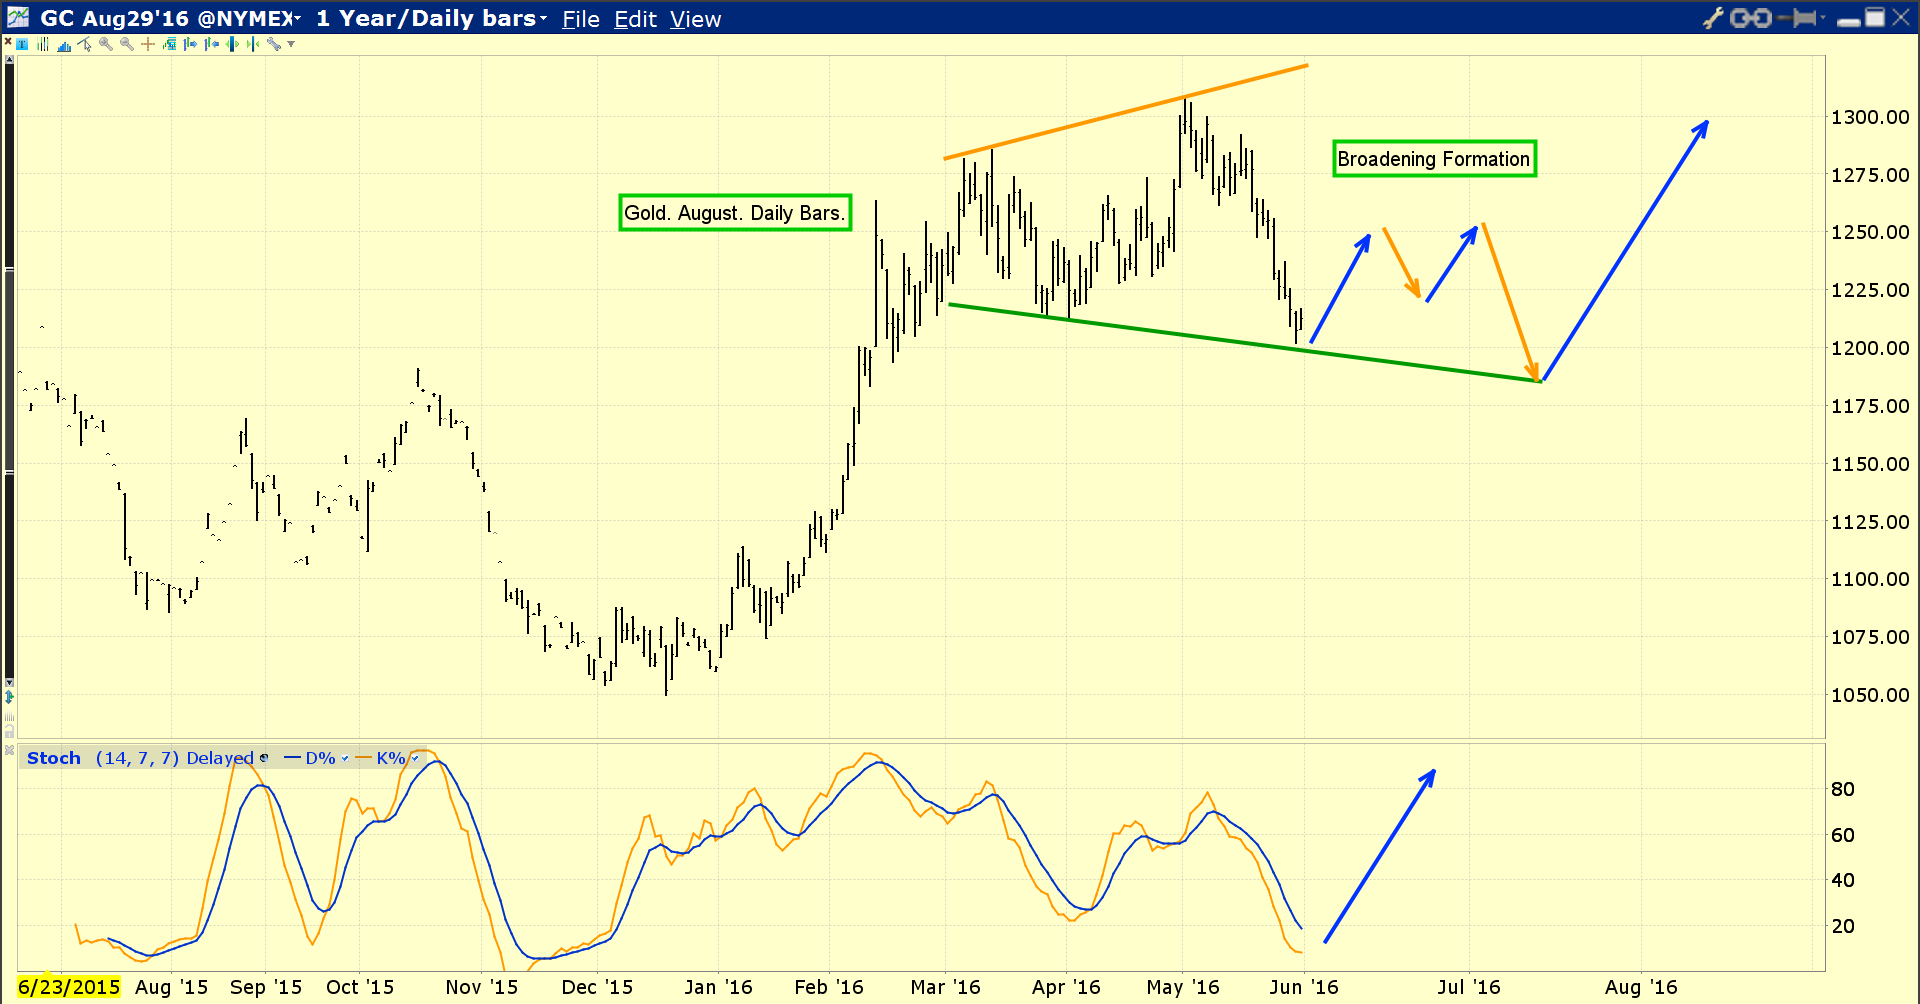
A broadening formation is now in play on this key daily gold chart.
Broadening formations are formed by higher highs and lower lows, and these patterns indicate a loss of control in the market.
I predicted the Fed would hike rates in 2015, and that would be a warning shot to the US government to get its financial house in order, or more hikes would follow.
I do not believe the Fed’s first rate hike had anything to do with GDP or employment, and nor will the rate hikes that follow. The Fed is enticing banks to move the “QE money ball” out of government bonds and T-bills, and into the private fractional reserve banking system.
There, it can be loaned out more profitably, and money velocity will begin to rise. For the first time in US history, rate hikes are not being used to cool inflation, but to heat it up. Rate hikes raise the cost of borrowing money for the government, and for stock market buyback programs that have created questionable price/earnings ratios in the US stock market.
Gold is trading in a broadening formation because institutional investors are beginning to sense a loss of control, emanating from both government and central banks.
I expect gold will trade essentially sideways until mid-July, which is when it often bottoms anyways. That’s because early preparations for gold-oriented Diwali begin in India, and demand begins to surge.
Demand from India was weak in 2013 because of the imposition of a duty and import restrictions, and in 2014 and 2015, because the monsoon season in both years was very dry.
The 2016 monsoon season looks good. It should produce great crops, and gold demand from millions of farmers will rise significantly as that happens.


Leave A Comment