A number of readers have emailed me in recent weeks wondering about Verizon’s (VZ) dividend safety.
Their anxiety developed after reading several articles online that suggested Verizon’s dividend was no longer sustainable because the company’s free cash flow did not cover it last year.
However, Verizon scores a 93 using our Dividend Safety Scores, indicating that its payout remains very secure.
I believe Verizon is one of the best high dividend stocks for current income, so I was interested to review what all of the fuss was about.
I will do my best to walk through Verizon’s financial statements (grab some coffee now to stay awake) and objectively review the company’s dividend safety.
Let’s start with a close look at the main argument against the safety of Verizon’s dividend – abysmal free cash flow coverage.
What is Free Cash Flow and Why Does It Matter?
Free cash flow is one of the most important financial metrics to understand for successful dividend investing.
Free cash flow represents the cash flow remaining after a company has made the investments necessary to maintain and grow its operations.
Free cash flow can be used to return capital to shareholders, acquire businesses, and repay debt.
Companies that consistently fail to generate free cash flow are unlikely to be able to pay sustainable dividends, repurchase shares, or have enough funds available for acquisitions or debt repayments.
Free cash flow is calculated using the company’s statement of cash flows.
According to Verizon’s non-GAAP reconciliations file, “free cash flow is calculated by subtracting capital expenditures from net cash provided by operating activities.”
Capital expenditures primarily consist of money spent on property, plant, and equipment to maintain and grow a business.
Cash provided by operating activities essentially adjusts net income for non-cash charges such as depreciation and accounts for changes in working capital accounts, such as inventory and accounts receivable (e.g. a company’s cash decreases if it buys inventory that hasn’t been sold yet).
Let’s take a look at Verizon’s cash flow.
Analyzing Verizon’s Free Cash Flow
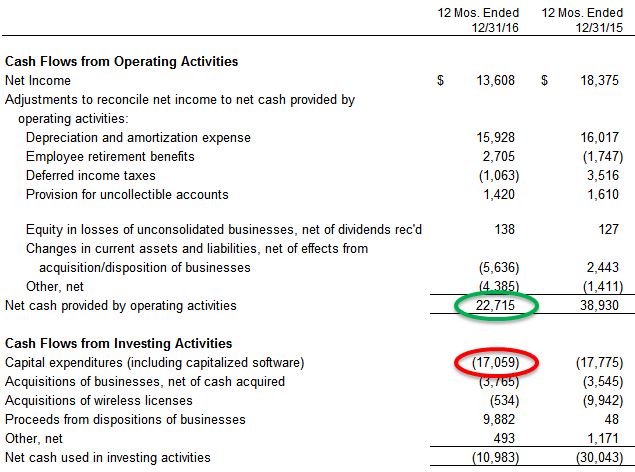
Verizon reported $5.7 billion in free cash flow in 2016, which can easily be checked by subtracting its $17 billion in capital expenditures (circled in red below) from its $22.7 billion in net cash provided by operating activities (circled in green below).

You can see that Verizon’s annual report pulls out those two figures in the table it uses to display free cash flow:

Many dividend investors pay close attention to a company’s free cash flow to see how well a dividend payment is covered.
The company’s $5.7 billion in free cash flow last year did not come close to covering the $9.3 billion in dividend payments that Verizon made.
Even scarier, you can see that Verizon’s free cash flow per share dropped significantly in 2016 to reach $1.38, well short of the $2.285 per share paid in dividends.

Source: Simply Safe Dividends
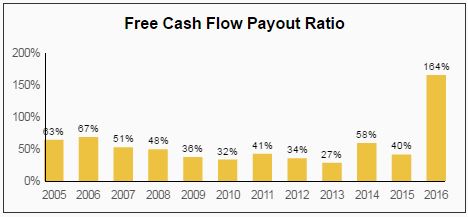
As a result, Verizon’s free cash flow payout ratio spiked well above 100% in 2016. The company’s payout ratio had never exceeded 70% going all the way back to 2005, so this change really stands out.

Source: Simply Safe Dividends
Before running for the hills and assuming that Verizon’s dividend is doomed, a much closer look at the company’s full statement of cash flows is warranted.


Leave A Comment