While many investors still believe that gold and silver will crash along with the markets as they did in 2008, I think we may see quite the opposite. In this video update, I provide even more important information on why the gold and silver setup today is much different than it was in 2008.
Also, it’s important to understand that when I discuss this information, I am not concerned about what happens to the precious metals or the markets today, tomorrow, next week or even next month. Rather, I am focused on the long-term trend change. Which is precisely why I show these charts using a “monthly timeframe”.
Furthermore, I answered the question by many commenters in the previous video on the validity of a “200 Month Moving Average.”Yes, there is such a thing, and if you watch the video, you will find out why there is and why it’s important to use it as a guide for changes in long-term trends:
(Video length 00:15:28)
In the video, I explain why the gold and silver price is currently searching for a BOTTOM, while they were extremely OVERBOUGHT in 2008 (as well as in 2011, technically speaking). Please understand, I am not saying gold and silver can’t go lower, but the indicators don’t point to a massive selloff as they did in 2008 because both precious metals have been in a 7-year bear market, not a 7-year bull market as they were from 2001-2008.
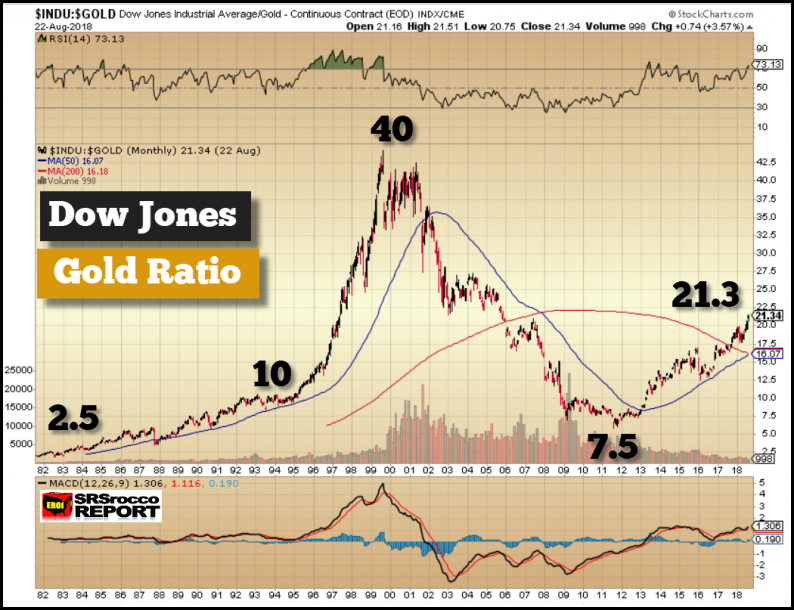
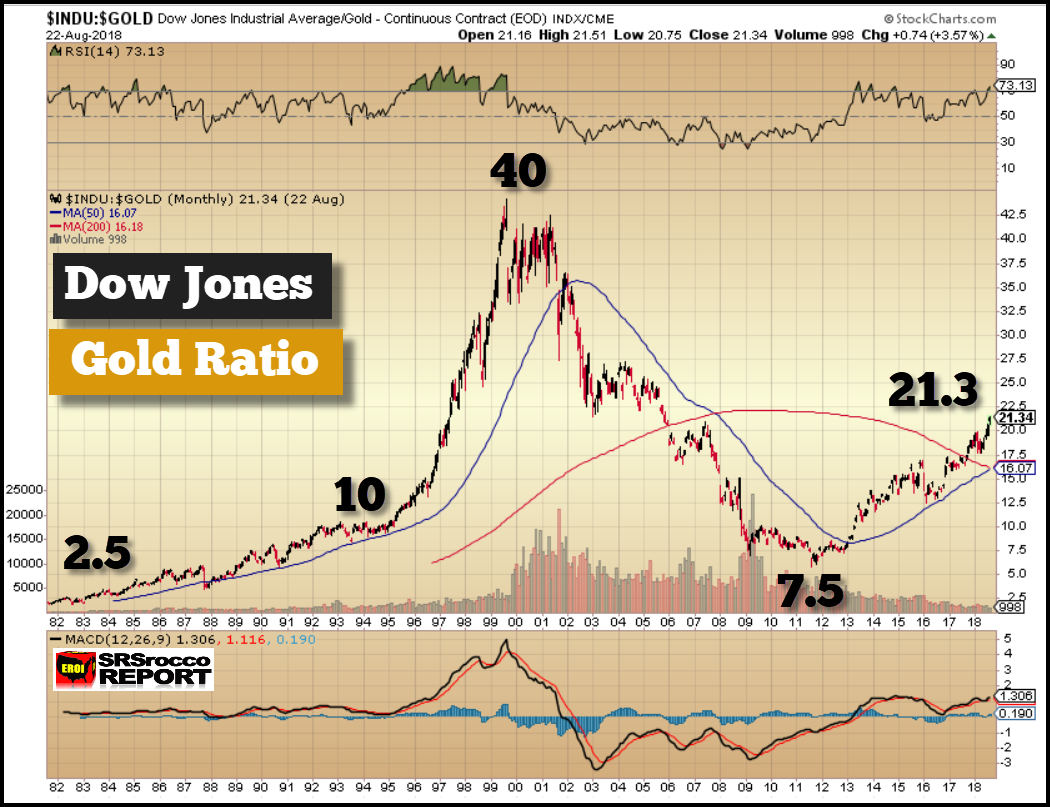
One of the charts I explain in the video is the Dow Jones-Gold Ratio. This is just dividing the Dow Jones Index by the gold price. Currently, the Dow Jones Index can buy 21.3 oz of gold versus 6 oz of gold at the peak in 2011 and 2.5 oz of gold in 1981.
Lastly, I really believe we are going to see one heck of a GOLD & SILVER BREAKOUT after the markets correct and crash lower. Not only will we likely see a considerable increase in physical gold and silver investment demand, but we will also experience a tremendous run-up of the precious metals mining companies.


Leave A Comment