The first exchange-traded-fund (ETF) was launched in 1993 as a low cost, passive way to enter and exit exposure to the top 500 US companies by market cap (the S&P 500) without the work and cost of buying and selling 500 shares separately.At inception, the idea was brilliantly simple, and the investment sales world saw huge opportunity.
Since then, passive funds of all kinds have replicated like Gremlins in water.
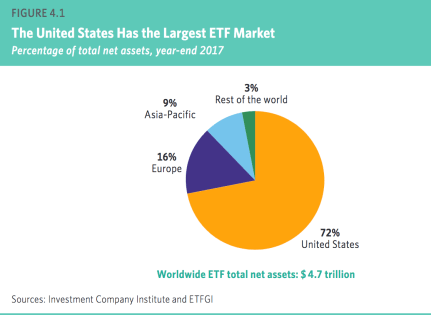
Capital held in global ETFs alone ballooned more than 6200% since 1999–and 70% in the last three years, according to the Federal Reserve (table here). They totaled $4.7 trillion at the end of 2017, with 72% ($3.4 trillion of it) held in 1,832 US based ETFs (as shown below from the 2018 Investment Company Fact Book).

Although the global bond market (issued by governments and corporations) is about 3 x the size of the equity market (issued just by corporations), the majority of investment funds and managers are concentrated in equities (where capital risks are higher, management and underwriting fees generally richer and blind hope eternal).
The trend is clear in the chart below of the dollar value held in exchange traded funds from 2000 to Q1 2016, with equity funds (in blue) compared with corporate and municipal debt (in orange) and government treasuries (in black).

Within the 72% of global equity funds allocated to US markets, the widely adored, and insanely valued top five US stocks (Facebook, Apple, Amazon, Netflix and Google) now account for about 12% of the S&P 500 index value and 27% of the Nasdaq 100 index (holdings which index-tracking funds and managers are mandated to replicate).
In short, a world of financial products and marketing wrappers are deceptively varied in appearance but remarkably similar in content.
Holding equity funds and trend-following are the rage as prices rise and then drive mass panic as prices fall and owners discover they are much less diversified than appreciated.


Leave A Comment