Stocks Not Overhyped
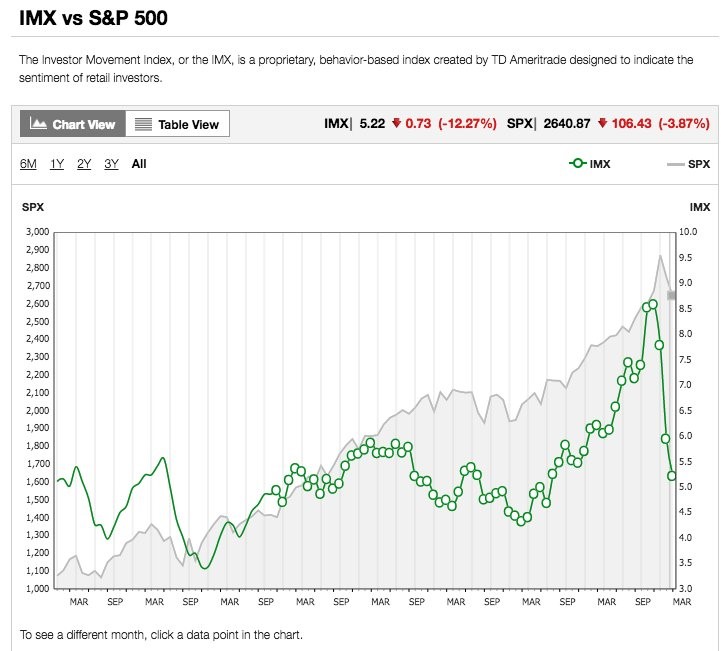
Whether stocks are showing signs of exhaustion depends on which indicator you review. The CNN Fear and Greed index makes me cautious about stocks, but the Investor Movement Index seen in the chart below shows investors are still cautious. The TD Ameritrade Investor Movement Index was 5.45 in July which is exactly the same as June even though July was the best month for stocks since January. This index was flat because, even though TD Ameritrade clients were net buyers of stocks, there was lower relative volatility among the most widely held stocks which include General Electric, Apple, and Amazon. The index is much lower than the peak in December.
To be clear, sentiment indicators only help us forecast short-term movement. Earnings growth will determine long-term prices. Every index showed stocks were wildly overbought in January. Some were at all-time records. Despite the peak in sentiment occurring in January, the equity market is about to make a new record high in August. That didn’t represent the peak of this bull market because earnings reports have beaten estimates and future estimates have been raised.

Strong Redbook Sales Report
The Redbook year over year same-store sales growth in the week of August 4th, 2018 was 5.6% which beat estimates for 4.2% growth. As you can see from the chart below, this growth rate is near the highest in this cycle. The highest ever reading was 7.6% which is 2 points higher. The average growth rate since 2005 has been 2.35%, showing us how strong this report was. The lowest reading was in July 2009 when the index declined 5.8%. This report showed a 1.4% acceleration from the prior week and was the fastest growth rate since December. This report counteracts the middling economic reports and the negative real wage growth. Yes, we can have good and bad reports come out simultaneously because they have different ways of measuring data.


Leave A Comment