With the mainstream media going gaga over the headline unemployment rate of 4.9%, let’s put a spotlight on actual employment with a focus on those aged 25-54.
Age group 25-54 ought to be out of school, not retired, not on disability, and working somewhere. Here are some chart that show what has actually happened.
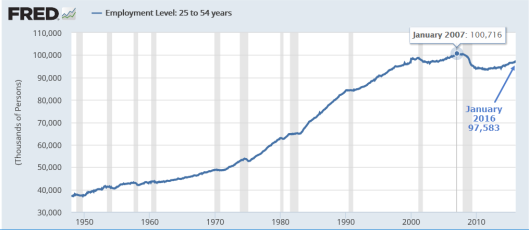
Core Employment 1950 to Present

Core Employment Detail

Core Employment vs. Population

These awful numbers do not account for part-time workers. If you work as little a 1 hour a week selling trinkets on eBay, you are considered “employed”.


Leave A Comment