Looking at previous week’s Commitments of Traders Report, changes in speculator positioning across major currencies and commodities are fairly limited. The most substantial changes can be seen in the US dollar index, British pound and Japanese yen. Net positions for all three currencies were up last week.
While speculator positions in the US dollar index are up this week, they are falling based on our implied measure of US dollar positioning. Following a turnaround that started last April, speculators have been increasing their bullish bets on the US dollar while shorting ‘risk on’ currencies. For now, speculators are also short safe haven currencies (such as the Japanese yen and the Swiss franc), in relation to the dollar.
Looking at extremes in positioning, there are few changes this week. The British pound net short position is no longer at a bearish extreme this week. Long US dollar, short euro and short gold remain two standard deviations above 12-month trailing averages. Short gold and short Swiss franc positions are also at a bearish extreme, based on 36-month trailing averages.
The purpose of this weekly report is to track how the speculator community is positioned across various major currencies and commodities. When net long positions become crowded in either direction, we flag extended positioning as a risk. Crowded positions do not suggest an imminent reversal, but should be considered as a significant risk factor when investing in the same direction as the crowd. This is shown below:
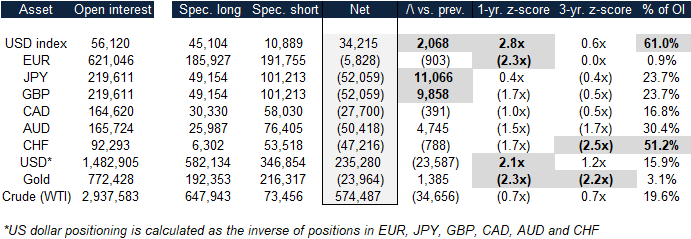
CFTC COT speculator positions (futures & options combined) – August 21, 2018

Source: CFTC, MarketsNow
Notable extremes, significant changes in weekly positions, and large net positions as a proportion of open interest are highlighted in gray above. Extremes in net positions are highlighted when speculator positioning is more than two standard deviations above trailing 1-year and 3-year averages. Weekly changes are highlighted when they are significant as a proportion of open interest. Finally, net positions as a proportion of outstanding interest are highlighted when they are large relative to historical averages. 1-year and 3-year z-scores are visually represented below:


Leave A Comment