Ok, here it comes. The number that will either change the financial world and alter the market landscape for the foreseeable future or make us all look like a bunch of fucking morons for staying up all night waiting on a completely innocuous data point that has little to no meaning whatsoever.
This needs no introduction, although if you’ve somehow missed the backstory you can read our week ahead preview, our Tuesday morning post, our Wednesday morning post, or really, just look at an ES chart starting two Fridays ago when the AHE print from the January jobs reported betrayed the swiftest annual pace of wage gains since 2009.
Bottom line: are inflation pressures really building in the U.S. and if they are, what does that mean for the Fed and is 3% on 10Y yields dead ahead with God only knows what implications for stocks?
Positioning is of course massively short in bonds although as Bloomberg reported on Tuesday, some folks look like they’re hedging for a rally down to 2.75% on 10s.
Here are the estimates and priors:
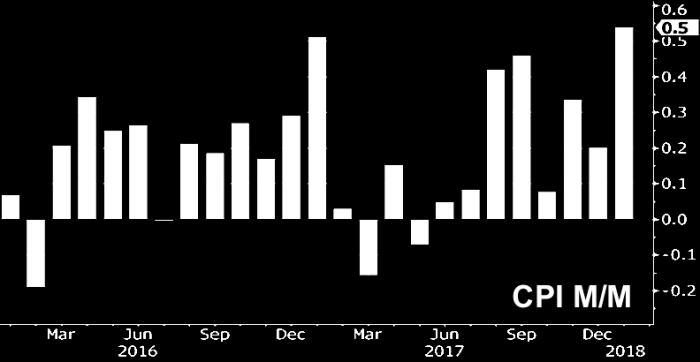
Here are the numbers:

Yields are surging:


Leave A Comment