
Quick take: Based on the August S&P 500 average of daily closes, the Crestmont P/E is 134% above its arithmetic mean and at the 100th percentile of this fourteen-plus-decade monthly metric.
The 2011 article P/E: Future On The Horizon by Advisor Perspectives contributor Ed Easterling provided an overview of Ed’s method for determining where the market is headed. His analysis was quite compelling. Accordingly, we include the Crestmont Research data to our monthly market valuation updates. See also his latest update: Understanding Secular Stock Market Cycles.
The first chart is the Crestmont equivalent of the Cyclical P/E10 ratio chart we’ve been sharing on a monthly basis for the past several years.
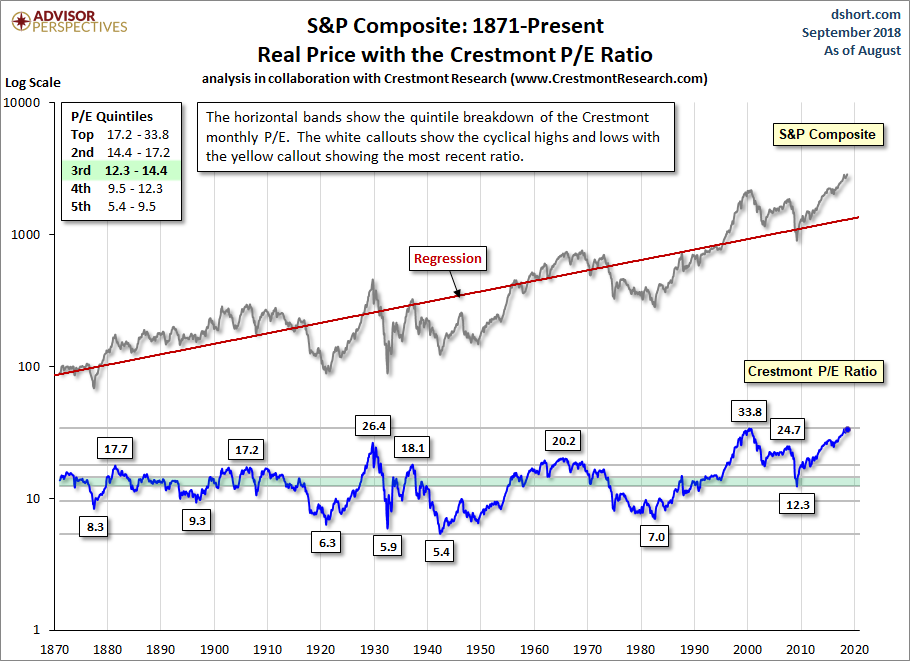
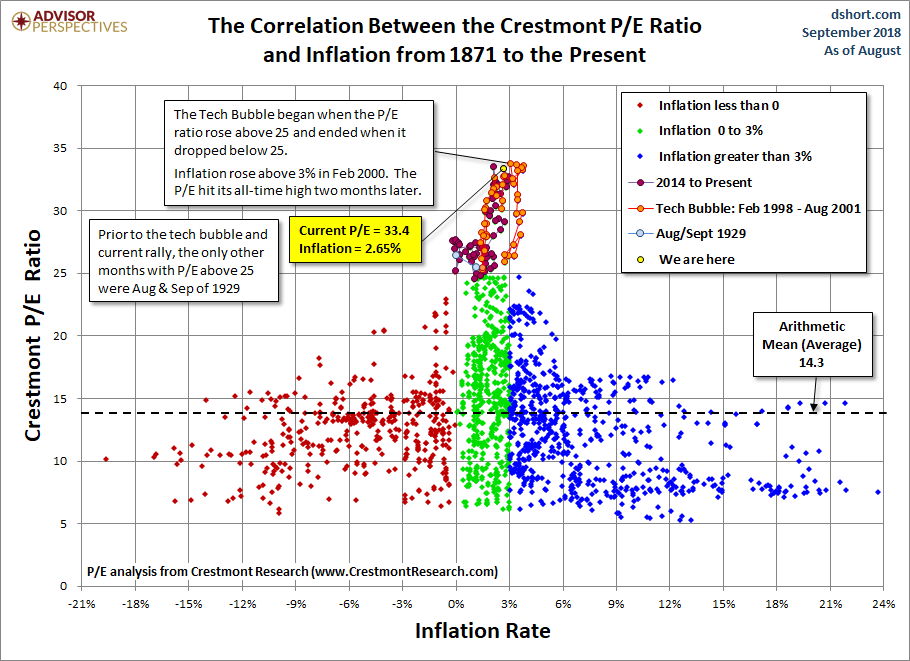
The Crestmont P/E of 33.4 is 134% above its average (arithmetic mean) and at the 100th percentile of this fourteen-plus-decade series. We’ve recently highlighted a couple more level-driven periods in this chart: the current rally, which started in early 2014, and the two months in 1929 with P/E above the 25 level. Note the current period is within the same neighborhood as both the tech bubble and the 1929 periods, all with P/E above 25 and is certainly in the zone of “irrational exuberance”.
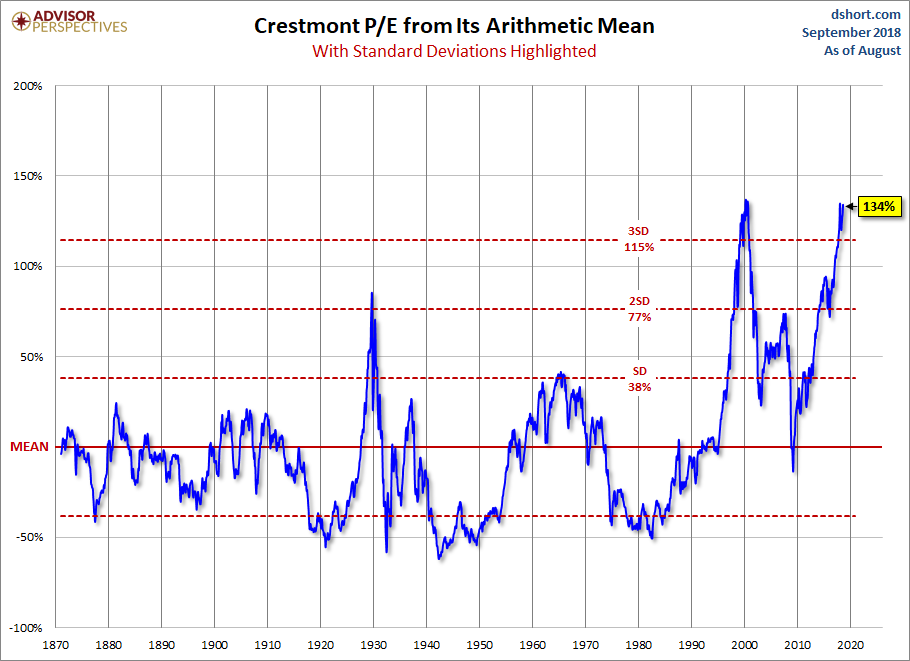
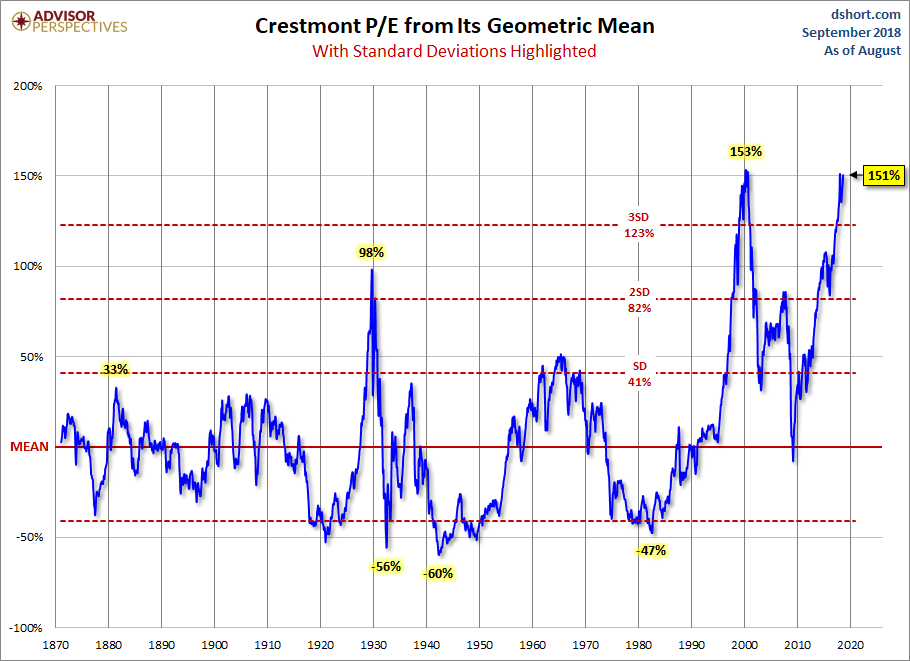
Crestmont Deviation from the Mean
Here is a pair of charts illustrating the historic Crestmont P/E ratio from its mean (average) and geometric mean with callouts for peaks and troughs along with the latest values.
Background on Ed Easterling’s Crestmont P/E
For a better understanding of these charts, please see Ed’s two-part commentary here:


Leave A Comment