
 Image Source: Pixabay
West Texas Intermediate (WTI) Crude Oil prices have rebounded 2.8% on Friday, climbing from a daily low of $75.35 and testing into $77.50 heading towards the close after a rough week that has seen WTI shed 8.61% peak-to-trough.Broad-market concerns about further escalations and a spillover in geopolitical conflict from the Gaza Strip conflict have eroded out of markets and replaced with newfound investor fears that global Crude Oil demand is failing to grow as fast as many had predicted. The long-running assumption that global oil production would undershoot demand, which initially sent WTI climbing into year-long highs near $94.00 per barrel.Crude Oil chronic undersupply proving nonexistentDespite significant production cuts from key member states of the Organization of the Petroleum Exporting Countries (OPEC), global oil demand has failed to materialize in a meaningful way, specifically weighed down by a notable lack of Crude Oil demand from China.US Crude Oil stocks declined sharply last month, but the drawdown is larger a result of oil refiners capitalizing on soaring oil prices, and Crude Oil stocks continue to rebound almost as quickly as they declined.WTI Technical OutlookWTI is down 14% from the last swing high into $89.65 in October, declining into a near-term low of $74.95. Crude Oil declined into the 200-day Simple Moving Average (SMA) this week, tumbling through the technical barrier and Friday’s bids are sending WTI back into the moving average as prices pin to the median.The last technical swing low in early October that saw congestion mear the $82.00 handle has marked out a potential inflection point that could pivot into technical resistance for any topside challenges next week.WTI Daily Chart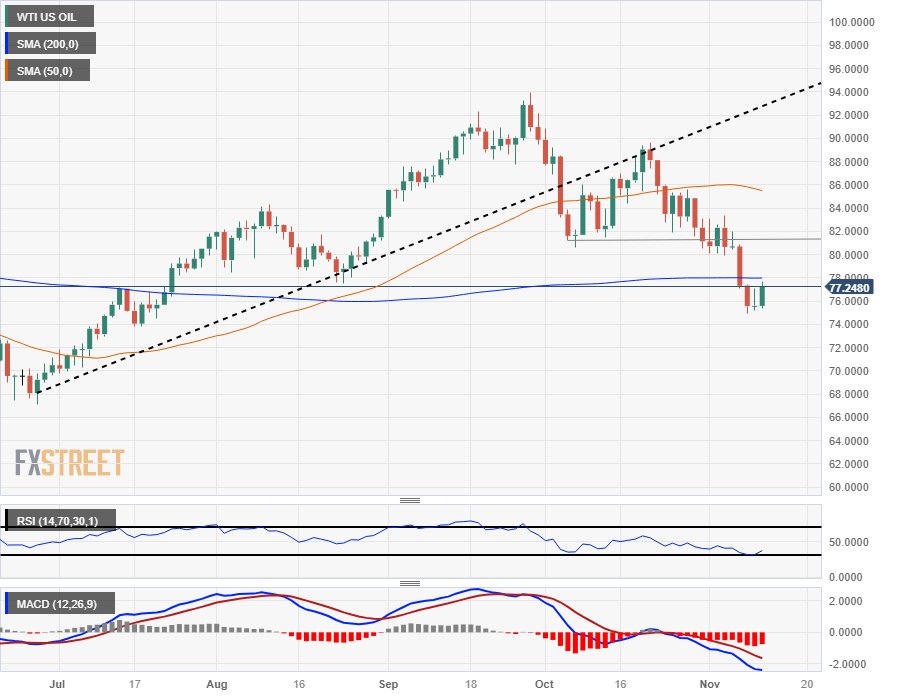 WTI Technical LevelsWTI US OIL
More By This Author:US Dollar Rallies As Powell Delivers Harsh Warning On Rate Hikes EUR/USD Attempts To Recover Recent Losses, Hovers Around 1.0670 USD/JPY Extends Its Upside Above 151.30 Ahead Of US UoM Data


Leave A Comment