
Fundamental Forecast for USOIL: Neutral
Talking Points:
The pressure in the physical oil market continues to lessen as the price of the front-month oil contract has fallen for the sixth week when looking to week-over-week changes in price. The future’s calendar spread between December 2018 and December 2019 dropped to the tightest (less buying pressure in the near-term) in Brent crude in nine months with the WTI equivalent seeing the tightest level since June.
Next week, OPEC is set to issue their monthly oil report on Monday on the same day as the EIA’s monthly Drilling Productivity Report. The next day, traders will get Chinese Data released at 10:00 Beijing time (22:00 ET August 13.)
The IEA, who advises most of the world’s major economies on energy noted in their monthly report this week that, “Concerns about the stability of oil supply have cooled down somewhat, at least for now.” Most of this is due to OPEC, and strategic alliances like Russia have boosted output so that supply shortage (and bullish prospects for traders) are falling.
Crude Oil Chart Tests 200-MDA Support
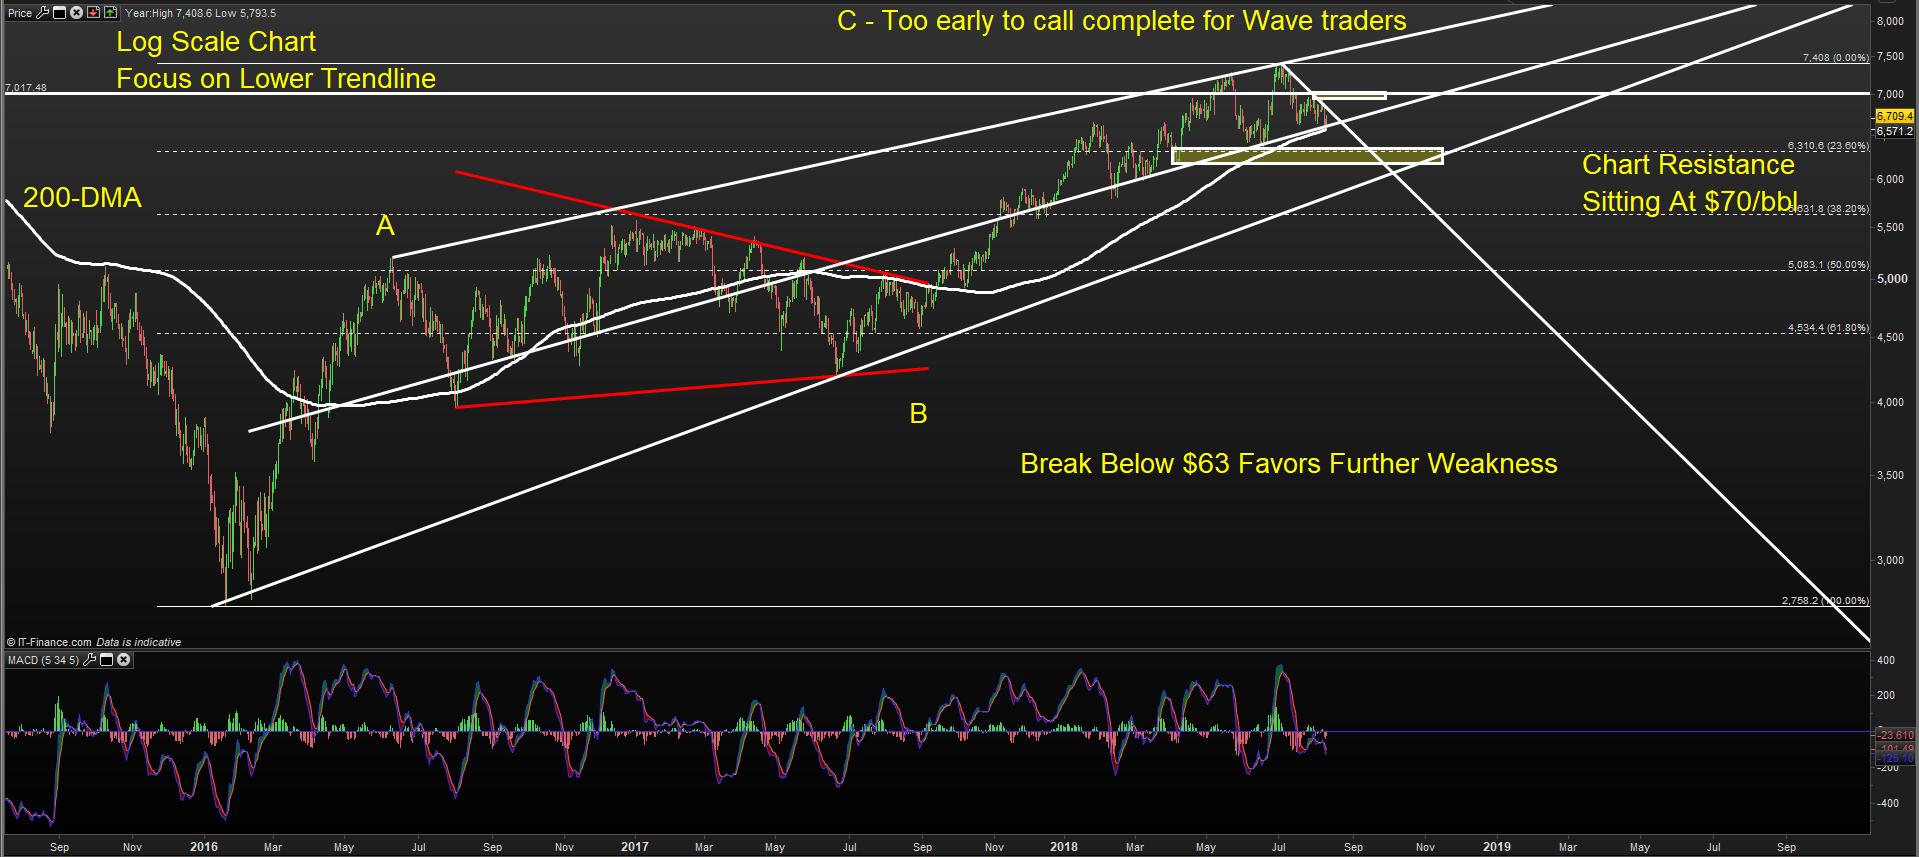
Source: Bloomberg
The drop in crude oil has yet to surpass anything witnessed in prior months. The price is approaching the 200-DMA as support. Only a break lower followed by an inability to move above the strong-handed 200-day price average could make a sufficient argument that we may not see oil trade above $70 for some time.


Leave A Comment