
Identifying problems is great. Identifying solutions is even better, especially when the politicians who are supposed to be solving our big problems don’t even try.In last week’s Debt Catharsis letter, I offered some ideas to start fixing the federal debt problem. To be clear, those ideas won’t balance the budget and in many ways are woefully inadequate. But even this feeble effort drew positive feedback from far and wide. That was gratifying and I hope encourages the leaders who can actually do something to, well, do something.Today I want to go deeper in explaining the scale of this problem and why it will get far worse, absent serious changes that are not presently on the radar.But first. Eavesdropping on MillionairesMy new book (written with my daughter Tiffani!), Eavesdropping on Millionaires, should be in stores this week!! You can order your copy now from Amazon, Barnes & Noble, Books A Million, or of course your favorite local bookstore.Maybe it’s the era I grew up in, but the release of a book is a pretty big emotional deal, at least for me. Tiffani and I literally sat down and interviewed scores (a hundred?) of millionaires, before the Great Recession, after, and then after COVID, plus 15,000 surveys. I am not aware of a longitudinal study like this, not just focused on data but on real-world people navigating crises.The stories and data are fascinating. In this book we choose dozens of millionaires who have significantly different ways of becoming a millionaire (or more!) and what happened to them in the last two economic crises!How often do you have the chance to sit down with a millionaire and ask, “How did you do it?” But that is exactly what we did and now you can read their stories.I am proud of the book. It is a quick read and will make a wonderful gift for friends and family (especially your kids beginning their journey). The orders this week (!) make a difference in the bestseller rankings, so thanks if you can!We hope you find it as fascinating as we did not only writing it, but also doing all those wonderful interviews. We made many new friends from whom we learned much.Now on with our topic. Inevitable UncertaintyDiscussing the debt problem is difficult in part because we have to see incomprehensibly large numbers. Quantities in millions, billions, trillions, and (soon) quadrillions just don’t occur in everyday life. Our brains revolt against processing them. Moreover, inflation and economic growth change the significance of these numbers over time. A billion dollars of debt in, say, 1970, was a bigger deal back then than it is now.One way around this is to express the debt as a percentage of real gross domestic product. This adjusts both for inflation (i.e., the purchasing power of each dollar) and the debt’s amount relative to the economy. This method has its own challenges, though, one of which is that GDP misses quite a few things. It’s not a great way to measure economic growth. It is the best yardstick we have, though.But forecasting the future debt as a percentage of GDP means we are estimating both sides of the equation. We have to make assumptions not only about how much debt the government will have at a specific future date, but also what GDP will be on that same date. Saying the debt will be X% of GDP in 2035 is a forecast divided by another forecast.That’s error-prone, but most of the error potential is on the debt side. GDP growth varies but over long periods is a fairly smooth line. Here it is from 1947 to the present. 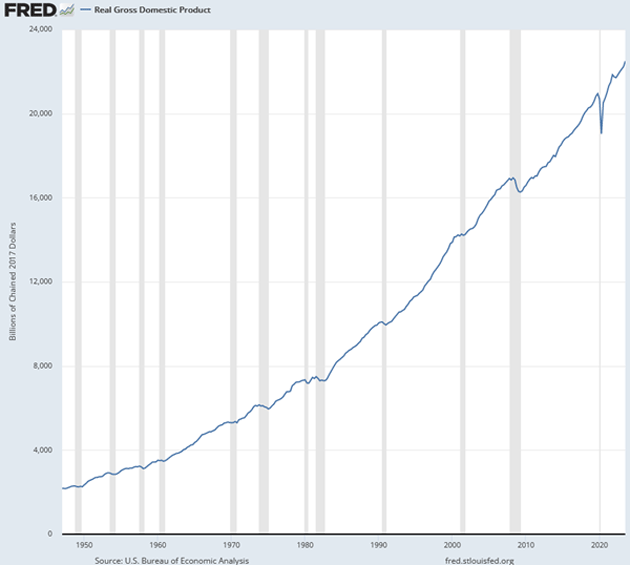
Source: FREDThe basic inputs to GDP are pretty simple: The number of workers x average worker productivity. These change but not quickly.The CBO’s GDP forecasts are essentially calculations from population growth and productivity estimates. Might those prove wrong? Sure. But it’s not hocus-pocus. The data is public, and the CBO shows its math.The revenue and spending estimates, on the other hand, are much more subjective for the simple reason Congress can change them. Unless we want CBO to start making guesses about who will win elections, it really can’t estimate future policies. By default, all its forecasts assume the current law will remain in effect indefinitely, which of course won’t happen.This inevitable uncertainty is one reason debt discussions are so difficult. But it’s no reason not to have them. So with caveats in mind, let’s go deeper into the CBO’s latest forecast.“Significant Risks”The CBO publishes two budget projections: a “baseline” for the next 10 years and a “long-term” covering an additional 20 years. This year’s baseline projections came out in May and were almost immediately superseded by the debt ceiling deal in June. The 2023 Long-Term Budget Outlook, released soon afterward, includes those changes, meaning it tells us more about the baseline years than the actual baseline. And it is bleak. Don’t take it from me: read the CBO’s own description. Here’s what they say about annual deficits.“In CBO’s projections, the deficit equals 5.8 percent of gross domestic product (GDP) in 2023, declines to 5.0 percent by 2027, and then grows in every year, reaching 10.0 percent of GDP in 2053. Over the past century, that level has been exceeded only during World War II and the coronavirus pandemic. The increase in the total deficit results from faster growth in spending than in revenues. The primary deficit, which excludes interest costs, equals 3.3 percent of GDP in both 2023 and 2053, but the total deficit is boosted by rising interest costs.”CBO includes this handy graphic which highlights the fast-growing impact of higher interest rates. (Note this is expressed as a percentage of GDP, subject to the limitations described above.) 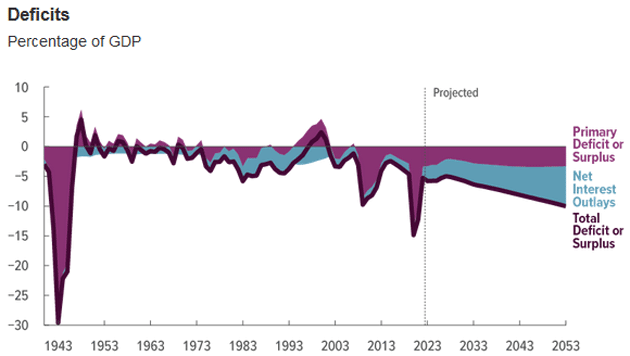 Source: CBOYou need to know some lingo here. “Primary Deficit” is the amount by which spending exceeds revenue, excluding interest. Add the interest and you get “Total Deficit” which, as you can see, will soon be more than the primary deficit.These deficits accumulate into the debt, about which the CBO also doesn’t mince words.“By the end of 2023, federal debt held by the public equals 98 percent of GDP. Debt then rises in relation to GDP: It surpasses its historical high in 2029, when it reaches 107 percent of GDP, and climbs to 181 percent of GDP by 2053. Such high and rising debt would slow economic growth, push up interest payments to foreign holders of US debt, and pose significant risks to the fiscal and economic outlook; it could also cause lawmakers to feel more constrained in their policy choices.”Here’s their debt graphic. It excludes intergovernmental debt, as I described last week, but still looks terrible.
  Source: CBOAccording to CBO the debt is now 98% of GDP and will almost double to 181% of GDP by 2053. That’s easy to believe because it already happened.In 1993 the debt was about 48% of GDP. Now it’s roughly twice that. Today’s policies—which, recall, are the basis for CBO’s forecast—will produce another doubling in a similar time span unless something intervenes. (Which is what I expect but I’ll save that for a future letter.)Finally, here’s how the CBO summarizes spending and revenue for the next 30 years.“Spending. In 2023, outlays fall to 24.2 percent of GDP as federal spending in response to the pandemic diminishes. Outlays continue to decline through 2026 but increase thereafter, reaching 29.1 percent of GDP in 2053. (By comparison, from 1993 to 2022, outlays averaged 21.0 percent of GDP.) Rising interest rates and persistently large primary deficits cause interest costs to almost triple in relation to GDP between 2023 and 2053. Spending on the major health care programs and Social Security—driven by the aging of the population and growing health care costs—also boosts federal outlays significantly over the next 30 years.“Revenues. Revenues fall to 18.4 percent of GDP in 2023 and continue to drop until 2026, when the scheduled expiration of certain provisions of the 2017 tax act causes tax receipts to increase. Revenues generally rise thereafter, reaching 19.1 percent of GDP in 2053, as an increasing share of income is pushed into higher tax brackets. (By comparison, from 1993 to 2022, revenues averaged 17.2 percent of GDP.)”And here’s the graphic.
 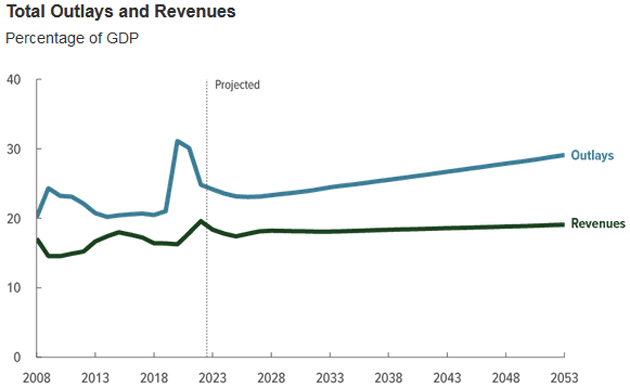 Source: CBONote how the left side, which is now history, is bumpier than the future forecast. That’s because the forecast assumes no policy changes, and of course they can’t forecast the recessions which caused those wiggles. What we need is some combination of the outlay line bending down and the revenue line bending up.Will that actually happen? I don’t know. If you had told me in 1993 we would both balance the budget a few years later and then double the debt in the next 30 years, and the economy would still be standing, I probably wouldn’t have believed you. Yet it happened. Curious AssumptionsElsewhere in the report the CBO breaks down how the outlays will grow. Here’s a summary graphic.
 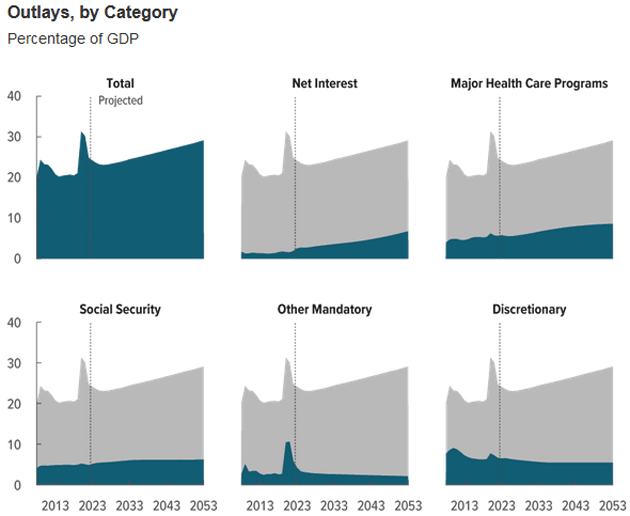 Source: CBONotice anything? The three categories on the bottom row—Social Security, Other Mandatory spending, and Discretionary programs (which includes defense) aren’t really the problems. They’re mostly flat.No, the main problems are on the top row: Net Interest and Major Health Care Programs. The CBO forecasts interest expense will grow from 2.5% of GDP this year to 6.7% in 2053. Healthcare spending will, they think, grow from 5.8% of GDP now to 8.6% in 2053, due to both population aging and healthcare cost inflation.And note well: That’s growth as a percentage of GDP, and the CBO assumes GDP itself is also growing. In dollar terms it would look far worse.That brings up another important point about assumptions. To make these forecasts, CBO has to fill in some numbers not just for GDP growth, but also inflation and interest rates. What are those assumptions?The CBO’s inflation assumption is a little curious. Without much explanation, the forecast says PCE inflation will grow at the Federal Reserve’s 2% goal over the next 30 years. That is strange when the Fed itself has failed to reach the goal. Hope springs eternal? CBO also makes a CPI forecast which is a little higher at 2.3%.The interest rate assumption is also odd, though in a different way. They project the 10-year Treasury rate will slowly rise from 3.9% to 4.5% over the next 30 years. They also think the Treasury’s average rate on the debt will be a bit lower than the 10-year rate, looking something like this.
 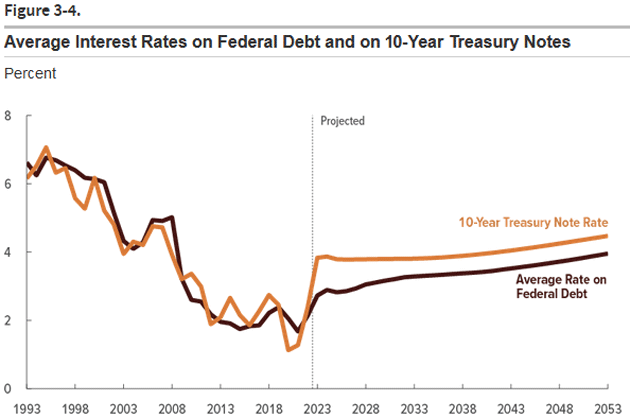 Source: CBONotice two things. First, CBO’s forecast is the government’s borrowing rate will spend the next 30 years lower than it was from 1993–2004, even though debt will be far higher as a percentage of GDP. But at the same time, CBO also expects rates to stay higher than they were from 2008–2023.Here is the CBO’s reasoning (my emphasis).“The agency expects several factors—including slower growth of the labor force, more private foreign and domestic savings available for investment, and slower growth of TFP than in that historical period—to continue to put downward pressure on interest rates through 2053. Slower growth of the labor force and an increase in the total amount of savings available for investment tend to increase the amount of capital per worker in the long term, thereby reducing the return on capital and, thus, the return on government bonds and other investments. Slower growth of productivity reduces the return on capital and results in lower interest rates, all else being equal.“That downward pressure is expected to be partly mitigated by upward pressure on interest rates from other factors, such as federal debt that is rising in relation to GDP. When federal debt rises, interest rates tend to go up, raising the cost of borrowing and, in turn, lowering private investment. That reduction in private investment tends to reduce the amount of capital per worker and further increase interest rates and the return on capital over time.”I had to read that a few times to make sense of it. In some respects, it resembles what Lacy Hunt has long said: Government spending has a negative multiplier which reduces productivity and is a downward influence on interest rates. CBO gets there a different way, pinning it on slow labor force growth and increased savings.I don’t really expect an agency that works for Congress to say, “Government spending depresses the economy.” I wonder if someone there is trying to say it more obliquely, though.The CBO staff no doubt has its biases, but also seems to understand basic economics. The following sounds like a conservative think tank but is straight from the CBO.“[T]he federal government borrows more each year. That increase in federal borrowing pushes up interest rates and thus reduces private investment in capital, causing output to be lower in the long term than it would be otherwise, especially in the last two decades of the projection period. Less private investment reduces the amount of capital per worker, making workers less productive and leading to lower wages. Those lower wages reduce people’s incentive to work and, consequently, lead to a smaller supply of labor.”The agency sees the same on the revenue side.“Higher marginal tax rates on labor income would reduce people’s after-tax wages and weaken their incentive to work. Likewise, an increase in the marginal tax rate on capital income would lower people’s incentives to save and invest, thereby reducing the stock of capital and, in turn, labor productivity. That reduction in labor productivity would put downward pressure on wages. All told, less private investment and a smaller labor supply decrease economic output and income in CBO’s extended baseline projections.”The CBO’s job is to inform the House and Senate of how legislation will affect the budget and, more broadly, the entire economy. Those last two quotes indicate CBO knows the score and, within the limits of its mandate, is trying to tell Congress what is coming.If only Congress were listening.Next week we will actually look into alternate scenarios that the CBO itself created and do a little extrapolation of our own. Reality will have its own way of forcing us into difficult compromises. But that’s actually a good thing! The Future of EnergyLongtime readers will know that I am bullish on energy (oil and gas in particular), precisely because the ESG movement, including numerous governments, is limiting both the amount of money and places that can be drilled for oil and gas. Economics 101 says that if you reduce a supply of something that has an increasing demand the price is going to rise. Felix Zulauf and others at my conference were talking about $120?$150 oil next year. In a normal world, that shouldn’t happen, yet it is. I am taking advantage by becoming a partner in an oil operating program—a rather large change for me, as I had to close my broker-dealer firm in order to do so.For those with true risk capital, I would invite you to see what we are doing at King Operating. We are physically drilling for oil and gas in older, underdeveloped fields planning to improve their value. Typically, the older fields were all vertical wells, but you can improve the value of that old field by using modern technology and doing horizontal drilling and fracking. It is similar to buying an older apartment complex in a great neighborhood, upgrading and renovating it, raising rents and then selling it to someone who wants to be in the apartment management business.More By This Author:Debt CatharsisBrushfires EverywhereSupercycle Of Debt


Leave A Comment