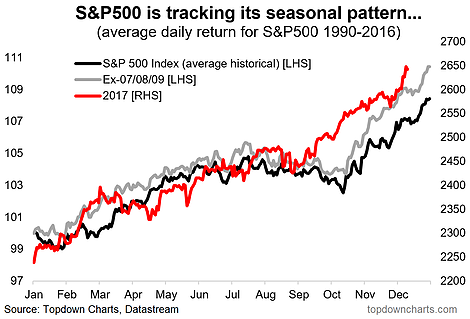
The “Santa Claus rally” refers to the tendency for the S&P500 to do well in December, and specifically the last part of December. We can assess this quantitatively with the first chart showing the average price experience across the year by trading day – it also shows how 2017 has been tracking against the averages, and so far it has been lining up reasonably well (except for defying seasonal gravity in Sep-Oct).
But perhaps more telling it the detailed statistical table of monthly returns. It shows December ranked no. 2 in terms of average returns, first equal on the percentage of times returns were positive, respectable best ever return, and smallest worst draw-down, it also had the lowest standard deviation of returns or variability (so you could also say it had the best shape ratio!).
Of course, the usual disclaimer is necessary: seasonality can and does have a habit of breaking down (not working)… particularly when you need it the most or rely on it! So it is more and interesting piece of additional context: something to be considered alongside a broader case of valuation, earnings/cycle, monetary policy, sentiment, etc. For that matter, my view is selloff risk is elevated, correction risk is medium, and at this point bear market risk is low.
As previously pointed out the S&P500 has been tracking more or less in line with its historical seasonal tendencies so far this year, albeit it defied gravity during the historically harder time of the year in Sep-Oct.

Looking in detail across the monthly return statistics December is actually ranked second in terms of average return, but first equal on proportion of the time returns positive, it also had the smallest drawdown and lowest standard deviation of all the months.

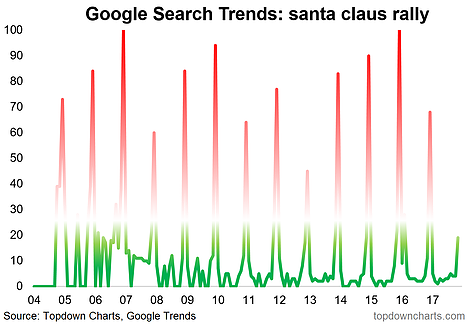
Looking at Google search trends there is a predictable pattern in search activity on the Santa Claus rally!


Leave A Comment