
EUR/USD
Weekly
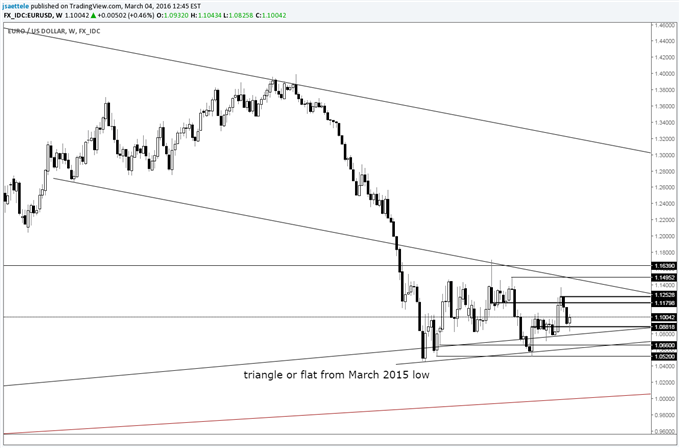
Chart Prepared by Jamie Saettele, CMT
See REAL TIME trader positioning
-The last FXTW noted that “the failed breakout could be bearish but EURUSD is still in a range (could end up as a triangle or flat from the 2015 low) and levels to pay attention to are 1.0872 (year open) and 1.0820 (May and July 2015 lows). The low this week was 1.0825 (on support). There’s no reason to get fancy here…this is a range and upside levels to pay attention to within the range are 1.1180 and 1.1250. A break above 1.1500 would argue for the flat pattern interpretation into the mid-1.20s.
-For forecasts and 2016 opportunities, check out the DailyFX Trading Guides.
GBP/USD
Weekly
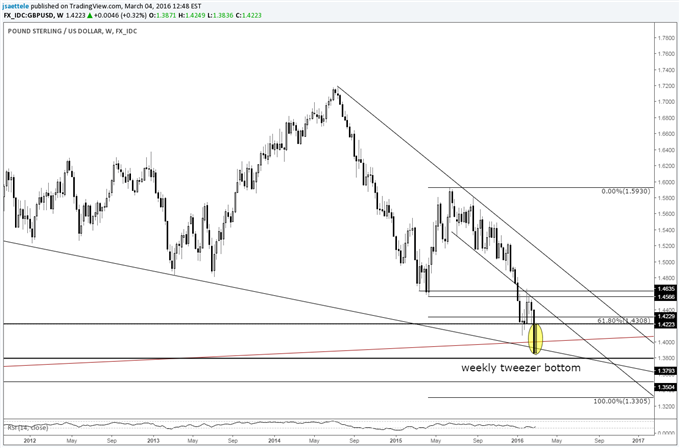
Chart Prepared by Jamie Saettele, CMT
See REAL TIME trader positioning
-GBP/USD has retraced a good portion of last week’s ‘BREXIT’ decline. FXTW came into this week looking for support near the 2009 weekly closing low of 1.3793. It was never reached as the open was more or less the low. Cable is finishing the week near the high. A close on last week’s low and the low to high move this week leave us with a ‘tweezer bottom’ candlestick formation (FXTW pointed out tweezer bottoms in AUD/USD at the September and January lows). This is a reversal pattern. The fact that the pattern formed amid the chaos of headlines (sentiment extreme on ‘BREXIT’) and at a confluence of trendlines (see below) indicates increased risk for a decent sized bounce.
GBP/USD
Weekly
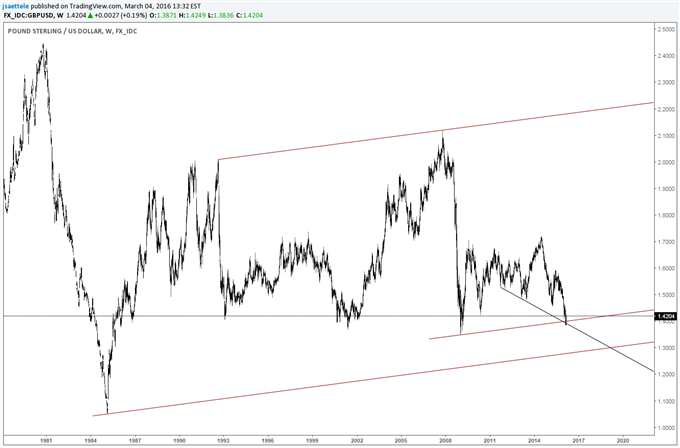
Chart Prepared by Jamie Saettele, CMT
See REAL TIME trader positioning
AUD/USD
Weekly
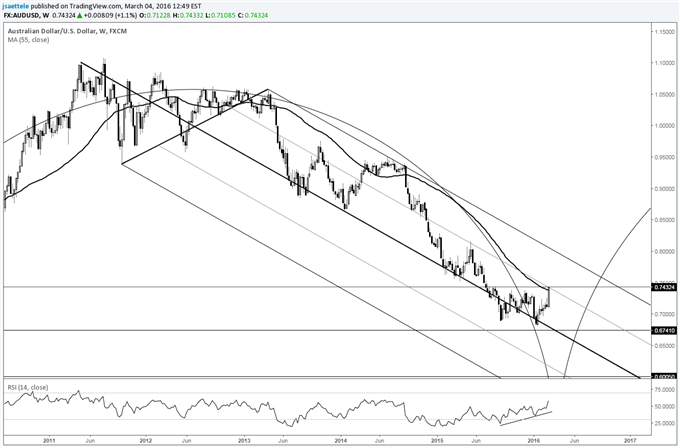
Chart Prepared by Jamie Saettele, CMT
See REAL TIME trader positioning
-Regarding AUD/USD, FXTW has maintained since the start of 2016 that “divergence with RSI on the weekly serves as a bullish reversal warning and that resistance may reside in the mid .7400s.” AUD/USD has pressed into the mid.7400s. The 55 week average is up here, which has been OK as a long term trend filter but this is also the slope line that was support in September and November 2014 before the breakdown and resistance in May 2015. A big decision looms for AUD/USD here.


Leave A Comment