
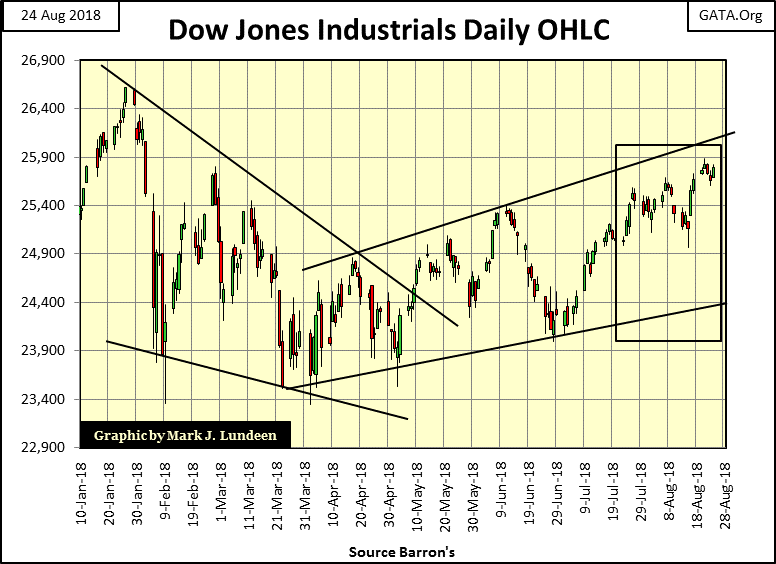
Closing the week only -3.10% from its last BEV Zero, the Dow Jones is progressing towards a new all-time high in its BEV chart below as it cleared the -3.43% from late February (Red Circle). Only 3.10% from a new all-time high and as much time as it needs to do it. But if it hasn’t closed within 1% from its January 26th’s BEV Zero by the time I get back in late September, I’ll have to wonder why.

Here’s the Dow Jones in daily bars, heading towards it last all-time high of 26,616 seen on January 26; heading upwards in baby steps is fine with me. That’s a gap of only 826 points from January’s last all-time high to where the Dow Jones closed today. That’s a little less than the Dow Jones has traveled since July 12 when it closed at 24,924.
The stock market is advancing perversely again, rising on declining trading volume. The Dow Jones (Blue Plot below) bottomed on March 23, and has been rising ever sense on declining trading volume (Red Plot). That’s unnatural.
If you believe in the law of supply and demand, you’d expect rising demand (rising trading volume) results in rising prices, and declining demand (declining trading volume) results in declining prices. From January 1900 to January 2000 (100 years) that was how the stock market worked. To be sure there were days, weeks and the rare occasional month that saw valuations rise or fall contrary to fundamental trends in trading volume. However, over the months and years of any advance or decline in the stock market, complementary trends in market valuations and trading volume held.
Bull markets saw rising demand as they drew in the public with the promise of easy money. Bear markets saw declining demand as the public withdrew from the markets after losing most, if not all of their life’s savings.
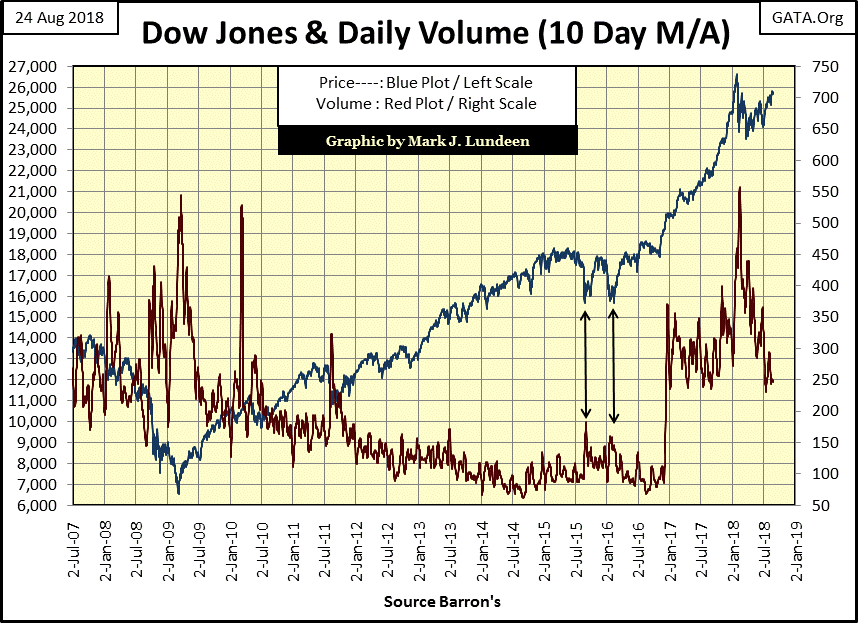
But all that changed after January 2000, where the stock market (using the Dow Jones as my proxy) typically advanced on declining trading volume, and declined on rising trading volume. This inversion of the law of supply and demand continued for sixteen years, until just after Donald Trump won the November 2016 election.


Leave A Comment