
Dogecoin chart analysisDogecoin price climbed to a new weekly high this morning at the 0.16438 level. The picture from the beginning of the week shows that the main price movement occurs in the 0.15800-0.16300 range.This morning, we jumped to a new high, which could influence us to see a slight move to the bullish side. We have EMA200 moving average support, and now we need a bullish consolidation to confirm the bullish option.Potential higher targets are 0.16400 and 0.16500 levels. We need a negative consolidation and pullback to the 0.16000 level for a bearish option. A break below pushes to the bearish side and a visit to the support zone of this week’s range.Potential lower targets are 0.15900 and 0.15800 levels. At the 0.15800 level, we will test the weekly open price, and we need to maintain above that level if we plan to stay on the bullish side. 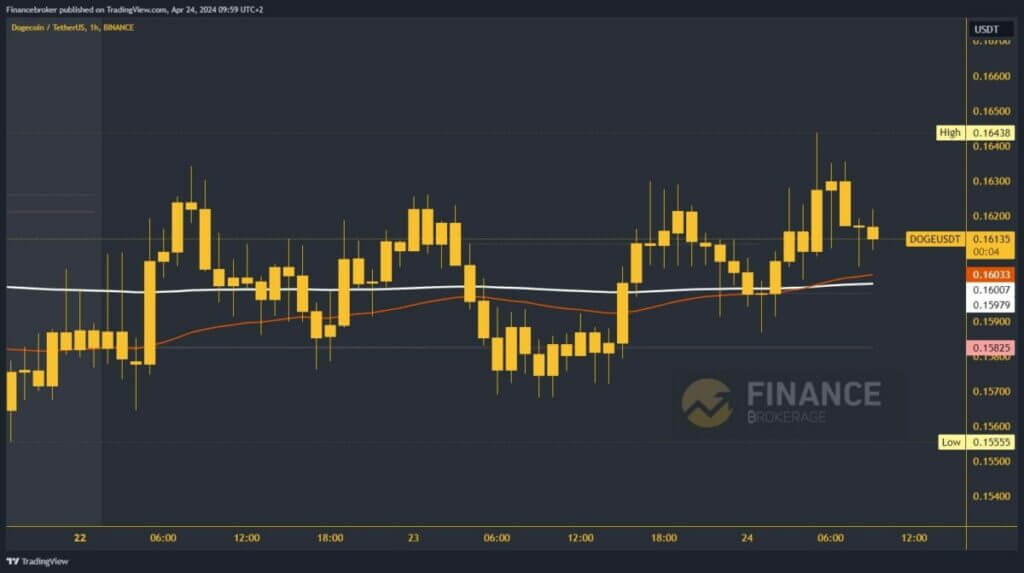 Shiba Inu chart analysisThe Shiba Inu price jumped to a new weekly high yesterday at the 0.00002814 level. After which we quickly moved back down to the 0.00002740 level. The pullback didn’t stop there, but we dropped to support this morning at 0.00002660.We encounter the EMA50 moving average there, and with its support, we initiate a new recovery. Today’s high is at 0.00002740 and we are holding below that level for now.We are currently at 0.00002710, and it is possible that we will see a test of 0.00002700 before continuing higher. Potential higher targets are 0.00002760 and 0.00002780 levels. We need a negative consolidation below 0.00002680 and the EMA50 moving average for a bearish option.After that, the price would be under pressure to start a further pullback. Potential lower targets are the 0.00002640 and 0.00002620 levels.
 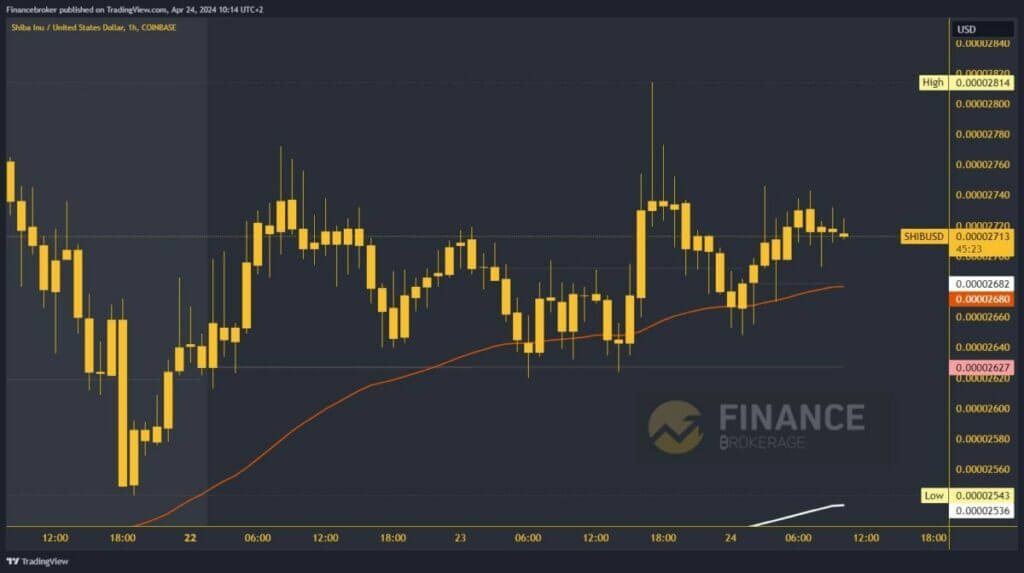 More By This Author:Bitcoin Price Is Slowly Stabilizing Above $67000 Level Alphabet Dominates With 76% Revenue From Advertising Solana And Cardano: Solana Continues Recovery Above $155.00


Leave A Comment