
Dogecoin chart analysisYesterday, we saw a bullish impulse in the price of Dogecoin to the 0.08170 level. We encounter resistance in that zone and begin a pullback to the 0.07680 level. Additional pressure on the price is created by the fact that we fell below the EMA50 moving average. This could result in us seeing a continuation of the pullback and a drop in price to lower support levels. Potential lower targets are 0.07600 and 0.07500 levels.We need a new positive consolidation and price movement to the 0.07900 level for a bullish option. Thus, we would climb above the EMA50 again and have the opportunity to gain its support and start a further recovery on the bullish side. Potential higher targets are 0.08000 and 0.08100 levels. 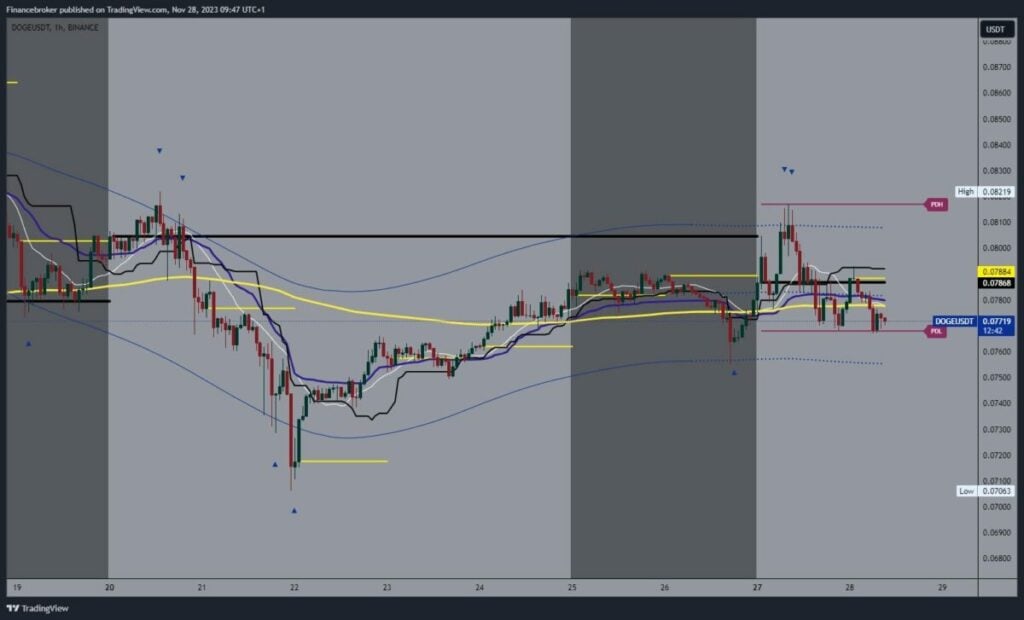 Shiba Inu chart analysisShiba Inu’s price jumped 0.00000865 level yesterday, forming a seven-day high. A pullback soon followed, dropping the price sharply to 0.00000800. We stop at that level, but we remain under bearish pressure. This could influence us to see a breakout below and the formation of this week’s new Shiba Inu low price. Potential lower targets are the 0.00000790 and 0.00000780 levels.We need a positive consolidation and a minimum move above the 0.00000820 level for a bullish option. Then, we would have to hold there and face the EMA50 moving average in the zone around the 0.00000830 level. With a break above, we would gain support in the EMA50, which would positively affect a bullish continuation. Potential higher targets are 0.00000840 and 0.00000850 levels.
 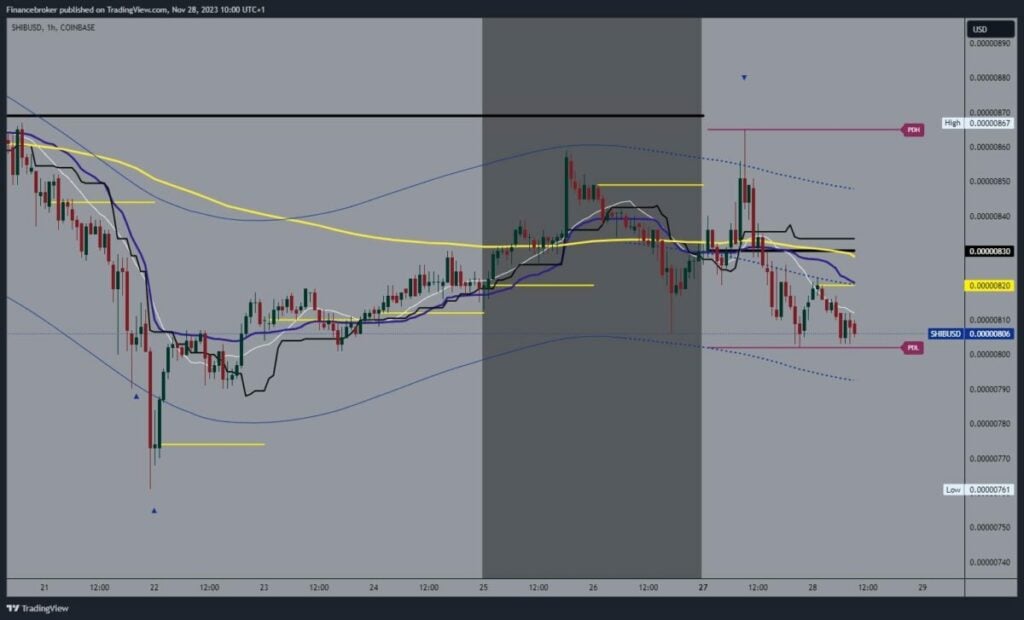 More By This Author:Bitcoin At $37,000, While Ethereum Is Struggling At $2,000
The Ripple Effect Of Oil Drops On Gulf Markets
The Dollar Index Remains Low Around The 103.20 Level


Leave A Comment