
The U.S. Dollar put in another bearish move this morning, with the past couple of hours wiping away most of the post-NFP gains that had come-in to the Greenback. One of the drivers, if not the likely culprit of the sell-off is a circulating report indicating that officials in Beijing have recommended ‘slowing or halting’ treasury purchases. The report came out via Bloomberg around 5:26 AM Eastern Time, and that’s right around the time that this recent sell-off began.
The timing of this warning is likely more than coincidence, as the 10-Year just crossed 2.5%, and last night, just hours before this report began to make its way through markets – a different report indicated that the U.S. would decide on trade sanctions against China later this month. While many are watching the situation around North Korea for heightened sanctions, the report last night indicated that the U.S. will be investigating sanctions as a remedy for the massive trade deficit that the U.S. has with China. The net response thus far has been a rise in U.S. Treasury Yields to go along with a move of pronounced weakness in the U.S. Dollar, as shown in the red box below.
U.S. Dollar via ‘DXY’ 15-Minute Chart: Post-NFP Gains Wiped Out by Sellers
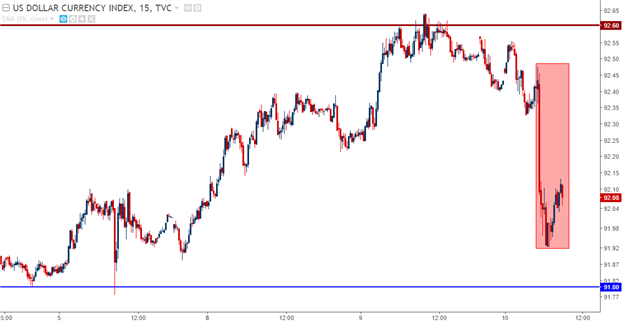
Chart prepared by James Stanley
We looked into the trajectory of the U.S. Dollar yesterday, and we’d pointed out the level of 92.60 as near-term resistance. That level held throughout yesterday, and with price action now making a fast run towards 2018 support around 91.80, the big question is whether buyers will be able to show some element of support on a re-test of that level.
U.S. Dollar via ‘DXY’ Four-Hour: December Swing-Low, January Swing-High; 2018 Support ~91.80
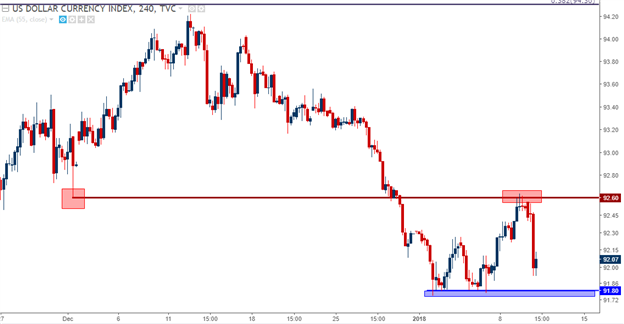
Chart prepared by James Stanley
On the daily chart below, we’re looking at the longer-term structure in DXY in the effort of identifying additional supports below near-term swing-lows. Just below short-term support, or the 2018 lows around 91.80, we have a potential support level around 91.36. This is the 50% retracement of the 2014-2017 bullish move in USD, and just below that at 91.01 we have the 2017 low that was set in the early portion of September.


Leave A Comment