
Today the market has experienced its largest intra-day decline for the year. There is no doubt that you’ll hear numerous explanations for the decline, from the health care bill, to Dodd-Frank and bank stocks. The truth is that these market correction are commonplace and they usually come and go without any real rhyme or reason. The simplest explanation for today’s price action is that the market was simply over extended in the short term and was due for a pullback.
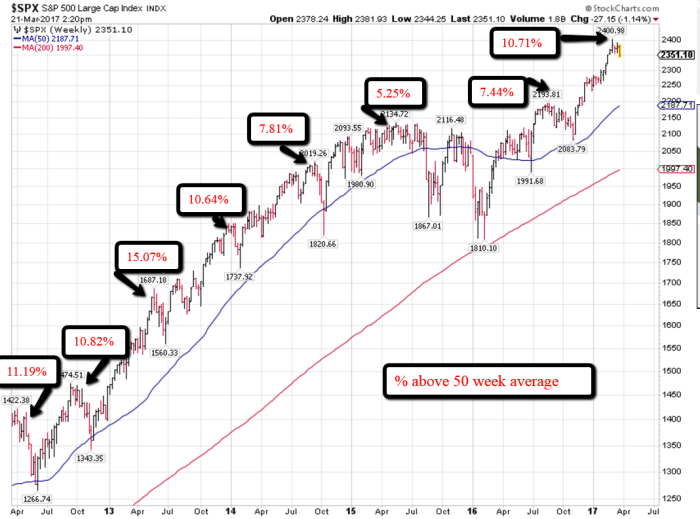
The chart above is the weekly chart of the S&P 500. We see that when price gets too far away from the 50 week average, there is oftentimes a reversion to the mean. This is natural and it doesn’t mean the “big crash” is upon us.
It’s been years since the S&P 500 got this far above its 50 week moving average. And in most instances when it gets 10%+ above the 50 week average, a correction usually follows.
Corrections between 5%-15% occur frequently, and it’s almost impossible to time. This is why having an allocation to high quality bonds can have some benefit. As they will generally appreciate and offset some of the decline in stocks, thus limiting the volatility of the total portfolio. This way you don’t need to try to time the corrections, you simply let the diversification benefits hold you over until the dust settles.
This is also a great time to assess your investment strategy based upon your emotions. If today’s actions have you concerned, you may be more aggressive then you can tolerate. After all, we are still only down about 3% from all time highs. So it’s not even an official correction yet. But it’s better to be prepared beforehand, because they don’t ring a bell and let you know the market is topped out and ready for correction.


Leave A Comment