
After over a month of foreplay, Dow 20,000 is in the rearview mirror.
And yet in retrospect, it didn’t take long. Deutsche Bank’s Jim Reid looks at how Dow numbers were first achieved and how long it took between each 1000 increment. Firstly the Dow only hit 1000 for the first time in January 1987. 5000 was reached in November 1995, 10000 in December 2003 and 15000 in May 2013. This is the quickest ever between round number thousand point increments as it only took 64 calendar days to go from 19000 to 20000.
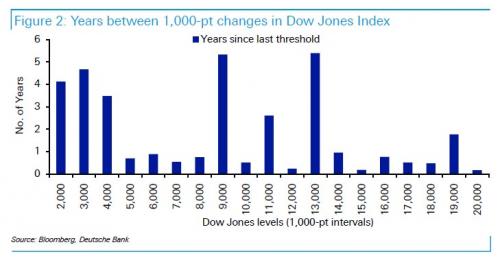
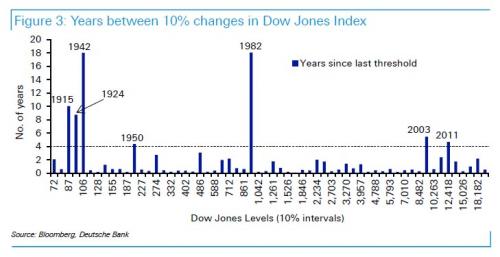
Of course, as the number gets bigger the % gains are smaller and therefore more achievable so this number is a little meaningless. Which is why DB also shows the graph of this and also one showing how long each 10% increase took working back from today’s 20000 level. The data goes back to 1900. The average length of time has been 1.9 years. On 7 occasions it’s taken more than 4 years and we’ve annotated these on the graph. Working backwards these were the 4.7 years to April 2011, 5.5 years to August 2003, 18.1 years to October 1982, 4.4 years to March 1950, 18 years to July 1942, 8.8 years to June 1924 and 10 years to September 2015.
And while the Dow 20,000 is nothing more than a “law of round numbers” milestone, it has bigger implications. What does it mean to professional investors, Bloomberg asked overnight, and found that it was “mostly a call for caution.”
The Dow Jones Industrial Average’s taking out of the latest round-number milestone pushed its gain since March 2009 past 200 percent. It also conjured memories of the damage done 17 years ago when the blue-chip index soared past 10,000, a siren song for individual investors seeking to jump into the dot-com euphoria.
Another sign of caution: strategists and money managers surveyed Wednesday by Bloomberg warned about chasing performance this time, citing concerns from stretched valuations to uncertainty over Donald Trump’s policies: history may be on their side. Data on market returns after 1,000-point milestones in the Dow show that while stocks tend to rise more than the historic average a month later, the performance over six- and 12-month periods trailed.


Leave A Comment