
In Part I of this series two systems, DMS Long Only and DMS Long&Short, demonstrated the advantages of momentum trading. Momentum trading has long been a favorite of investors and traders. Dynamic momentum trading, a concept that enables momentum measures to adjust to market conditions, is new and more sophisticated.
Applying dynamic momentum trading to a portfolio consisting of 45 ETFs amazing backtest results were achieved. Using ten years of data results were shown for twenty-four different trading combinations. The worst of these exceeded an S&P 500 buy and hold strategy by three times. The best of these did so in excess of twenty times.

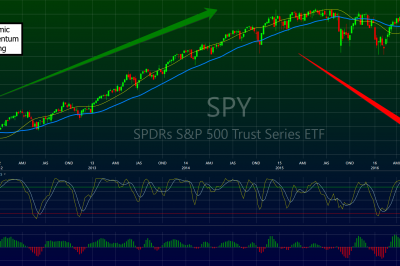
Bull and bear , symbolic beasts of market trend
This article will explore the results of one of these tests in detail. Its purpose is to enable the reader to better understand system mechanics and the trading cycle. The trading model to be used in this review is the DMS Long Only with Normal Trading Style andOne Trade per month.
Trade History
DMS Long Only with Normal Trading Style and one trade per month showed a ten-year profit of $115,658:
Note: The figure from this table differs slightly with the final one below. This article was written a day or two after the first one reflecting a day or two more data in the following table.
Individual Monthly Trades
The trades that produced the $115,000 backtest profit are detailed. The first trade took place on July 6, 2007. The table is current through close of markets on December 2, 2016.
For each trade, the entry and exit dates are shown as are the corresponding entry and exit prices. The cumulative profit represents total profit as of that date. The beginning equity was $10,000 and all equity is invested in the next trade.


Leave A Comment