S&P 500 Expected Move & Lacking Moves of 1%
The S&P 500 made gains each day of the prior trading week, ending with a weekly gain of 1.16 percent. The index is up 7.76% year-to-date. Despite all the macro and geopolitical concerns persisting through much of 2018, the S&P 500 is having another healthy year and is on track to once again deliver double-digit gains. Of course, there may still yet be a set back for the benchmark index, which only fails in performance level when compared to the Nasdaq (NDX).
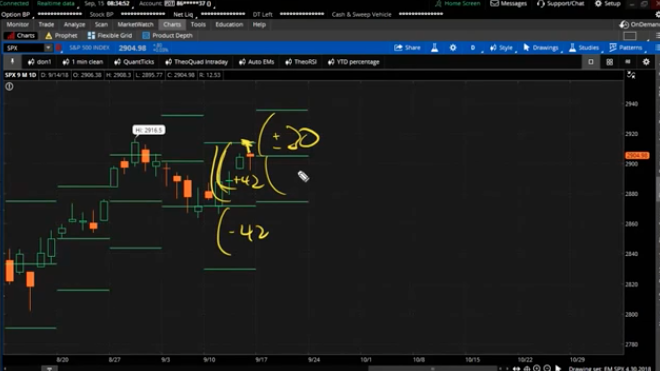
The SPX expected move for the coming week is only $30. I say “only $30” because the prior week’s expected move was $42, which failed to be achieved by only a couple of dollars and prior to Friday morning headlines on Trump’s tariffs to be levied on $200bn in Chinese imports.

Nonetheless, the expected move was not breached once again. The expected move has only been breached 3 times in the last 24 weeks. If any investor questioned the usage and relevance of quant and/or mechanical trading in the marketplace, look no further for evidence than the current trends in the weekly expected moves.
After coming off a rather complacent month of August, gauged by the lowest VIX median reading since 1967, the VIX has continued with the theme of complacency in the early parts of September. After a brief and modest pick-up in volatility during week 1 of September, the VIX has once again resumed its decline in week 2 of September and with the VIX breaking below 12 on Friday of last week, before closing out the week at 12.07.

Given the consistent sub-15 VIX reading for the last couple of months now, the S&P 500 has expressed 57 consecutive trading days with less than a 1% daily move. As shown in the graph above, the current streak is lesser than that of the 94-day streak snapped in January of this year. With the current VIX reading of just 12%, a pick-up in volatility will need to persist in order for the current streak to be snapped.
Yield Curve Inversion-Potential for VIX to Rise
There are always variables that can breed an increase in volatility from week-to-week and some of those variables may occur near-term. Yield curve inversion may prove to be the main driver of future market unrest, at least momentarily. Firstly, what is yield curve inversion? Yield curve inversion occurs when and where short-term yields (2yr T-bill) and long-term yields (10yr T-bill) move closer together and eventually the short-term yields are higher than that of the long-term yields. This happens as shorter-term yields rise following Fed’s rate hikes but long-term yields refuse to budge.
What will likely cause angst amongst the investor community is the fear of what is to come once the yield curve inverts and not the actual economic impact resulting from an inverting of the yield curve. In other words, even though a recession isn’t in the cards any time soon, due to the yield curve inverting, the fear can produce a negative feedback loop in the equity markets. As such, the markets can retrench with a resulting rise in volatility from the fear.


Leave A Comment