
Jeff Hirsch in the Almanac Trader updated the S&P 500 Performance during the First 100 Days of new administrations since 1953 in a post titled “February Weakness Stolen, March Stolen Thunder.”
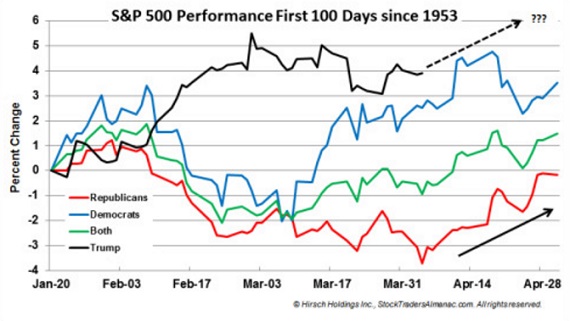
Looking at the chart below March was indeed a dud. Instead of a respectable rally, S&P 500 fell 0.04% in March. It has been eighty-two calendar days since President Trump took office and S&P 500 has gained 3.9% which is still above historical average.
Historically, March was a flat month for new Republican administrations (solid red line in chart below), but that weakness ended on average in early April and the S&P 500 rallied nearly 4% by the end of the month (black arrow).
A similar result this year would put S&P 500 off this chart by the end of the month. Recently we pointed out April marks the end of what is historically the best six months for DJIA and the S&P 500.
Since 2006, April has been up eleven years in a row with an average gain of 2.6% to reclaim its position as the best DJIA month since 1950. April is second best for S&P and fourth best for Nasdaq (since 1971).


Leave A Comment