
In Elliott Wave theory, after every five waves, a three-wave correction follows and after only three waves a reversal may occur. So, IOTA made big and deep three waves A-B-C of decline in 2018, which could have been completed and if we are correction, then a new bullish cycle can be already underway.
There are many tools and indicators, which could indicate trend reversals, such as RSI, MACD, Volume, but our primary tool was and will be always Elliott Wave. With RSI, Volume and Moving Average indicators, we are just collecting evidences, in other words, we are confirming our view, because confirmations are the most important when comes to trading, and patience of course.
Let’s take a look at daily IOTA chart. As you can see, we can count five waves down into wave C, so Elliott Wave can be confirming a reversal for at least three waves of recovery, especially if we get those black five sub-waves up, because five waves up from lows suggest more upside after a small pullback. It’s also interesting that IOTA found a potential bottom right at 0.40 psychological level, which can be as well very important evidence that bottom can be in place. If IOTA makes five waves up, then we will see a break above 50 Daily Moving Average, also RSI is already showing a divergence and we can see a huge increase in volume. That said, all these evidences signalize that IOTA can be turning into a bullish mode, at least a bigger recovery can be on the move.
However, at this stage it’s still too early for buying, but it will be very interesting, if we get those black five waves up into wave (A)/(1) and then only three waves A-B-C of pullback into wave (B)/(2).
IOTA, Daily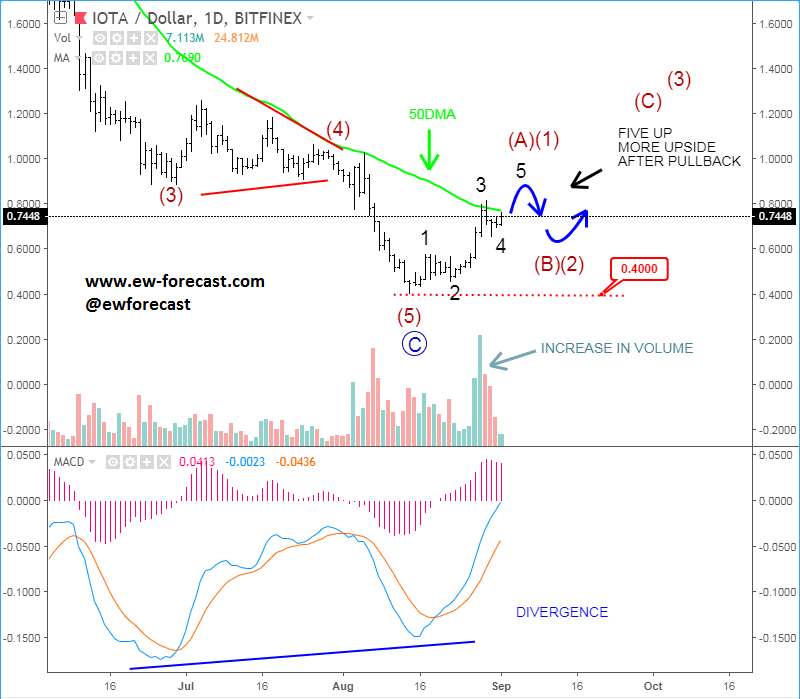


Leave A Comment