
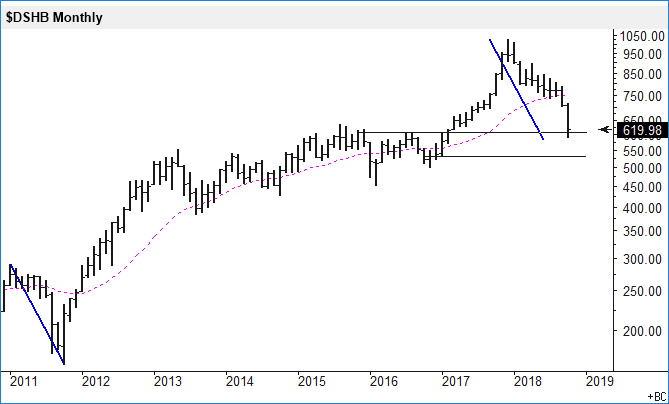
Here I have written a lot about housing-related stock indexes. They started to fall in middle of January and have underperformed the S&P 500 index by a huge margin this year. The charts below show the DJ US Home Construction Index on three different time frames.
On monthly, I see possible support in the 607-530 area. An equal swing down ends at around 585. Keep in mind I am using a semi-log scale.
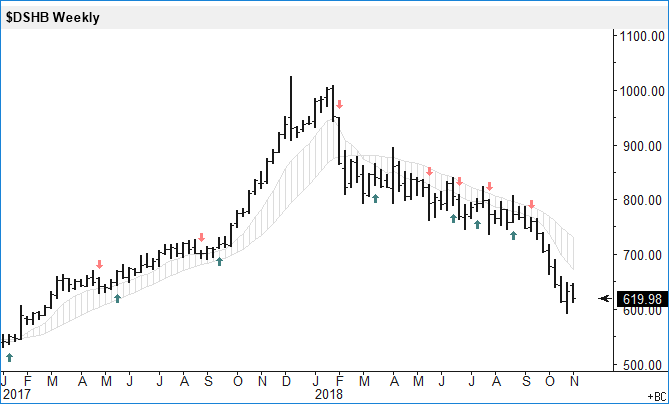
The trend on the weekly chart is clearly to the downside. Need to see if this week ends with an inside bar and a three-week triangle pattern. If so, then we are in possible breakout mode next week.
On the daily, the index has probably fallen too far, too fast from its smoothing line, so we could see a move towards the line (ca. 700-725) if the index can rise above the 660 level.


Leave A Comment