For the past few weeks, I have been providing regular updates on the status of crude oil inventories and production in the United States. Admittedly, this report is a bit late as it covers the week ending November 7 and I do apologize for my tardiness in getting this released. The prevailing trends in oil inventories over that week may come as somewhat of a surprise because oil prices continued to decline, taking motor gasoline prices and the stock prices of oil-related companies with it.
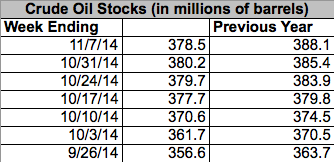
The week of November 7, 2014 actually saw the nation’s commercial oil inventories decline compared to the previous week. On November 7, there was a total of 378.5 million barrels of oil in all of the commercial oil inventories in the United States. The same inventories contained 380.2 million barrels of oil at the end of the week ending October 31, 2014. As has been the case for quite some time now, this was significantly less oil than what was in inventories at the same time last year.

This decline also represents a departure from the trend that was occurring last year. As the chart above shows, the nation’s inventories steadily increased on a week-over-week basis last year. While that same trend was also occurring this year, it did not over the past week.
The week of November 7, 2014 also saw an increase in refinery activity compared to both the previous week and the corresponding week last year.
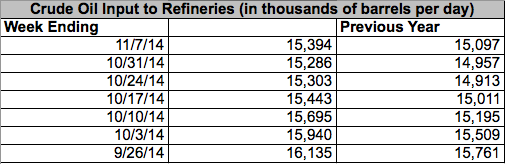
As might be expected, this led to an increase in gasoline production, which increased by an average of 3,000 barrels per day over the previous week. However, the amount of gasoline provided to the market over the four week period ending November 7, 2014 actually declined compared to the previous four week period as well as on a year-over-year basis.
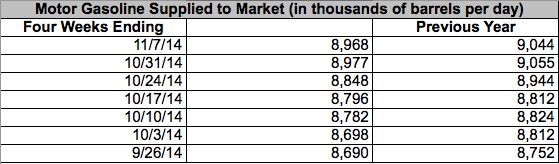
These dynamics are likely one reason why gasoline inventories actually increased in size compared to last week. However, inventories were still considerably lower than at the same time last year.


Leave A Comment