Nothing affects the markets and an economy more than “inflation” and for most economists, including those within the Federal Reserve of the United States, inflation seems to be a very difficult factor to get their hands around and to understand. This article is my attempt to once and for all bring “clarity” to this mystical factor we call inflation.
I am going to do this by showing the reader one simple graph that every investor in the United States needs to understand. Although they say a picture is worth a thousand words, I say the following graph is worth more than a thousand words. The following graph shows you the history of inflation in the United States, year by year, over the past 101-year period. The data comes from the Bureau of Labor and Statistics and is known as the Consumer Price Index (CPI).
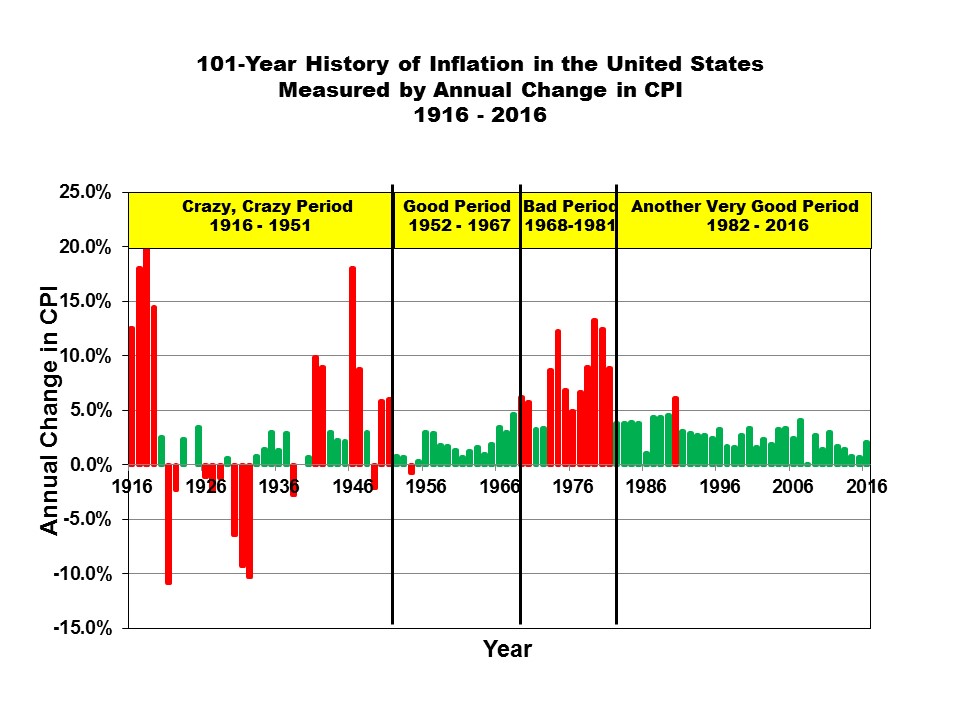
You may note that I have color-coded the bars in the above graph in “red” and “green”. Red bars reflect a period with “deflation” or a period when inflation was greater than 5.0%. Green bars reflect a period where inflation fell somewhere between 0-5%.
You may also note that I have segregated the above graph into four distinct periods, which I think most people, at least those who are not color blind, would say are reasonable segregations based upon color alone. Here is how I view the above four periods:
The crazy, crazy world period between 1916-1951. This period included two world wars, a great depression, and essentially ended near the end of the Korean War. It reflects a period when inflation was “out of control”—managing an economy through this period would have been nearly impossible. Note how this period included “deflation” unlike any of the other periods.
A good period for the economy between 1952-1967. This was a period when the United States, essentially free from the destruction of World War II, pretty much had things to its own, while the rest of the world recovered from that nastiest of nasty wars.
A not-so-good period for the United States between 1968-1981. This was a period that the United States had to deal with the cost of the Vietnam War, the cost of new federally supported social programs, the first “energy crisis” with rapid and significant increases in oil prices, and the effects of complacency from the second period.
A pretty darn good period that began in 1982 and which has continued through to the present time. This is a period that historians will look back and call the ”beginning of the technology economy” in a new world of Globalization—lead by the way, by the United States of America. America was and has been “Great” throughout this period, despite what some doomsayers and a recently inaugurated President may want you to believe.


Leave A Comment