
Ross Stores (ROST) has cratered by 17.5% year to date, despite decent first quarter results. I think it’s one of the better retail stores out there, and faces less threats from Amazon (AMZN) than many of its retail peers. “There’s always a bargain in store” is plastered on the first page of the company’s annual report, and I think that this might also be a fitting description of its shares as well.
What makes Ross better than most?
Ross earns very impressive headline returns on invested capital, likely far in excess of its weighted average cost of capital, or WACC. I created the below chart (and all others in the rest of the article) in Excel using data from its 10-K.

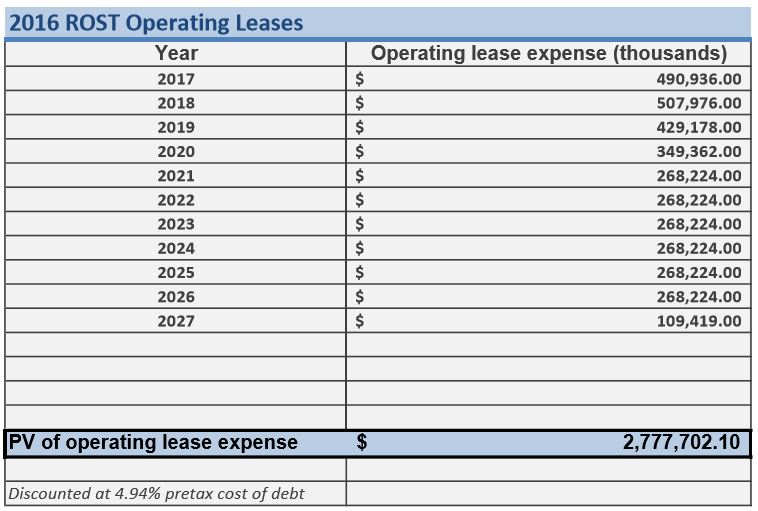
Ross has earned ROIC over 20% sustainably going back at least a decade, touching a little over 48% at its peak in 2013. It appears the company’s capital structure is very “debt light” as well, but Ross also utilizes quite a bit of leases that I’d like to theoretically capitalize and insert back onto the balance sheet. To accomplish this, we first need to discount these leases to obtain an estimate of their present value. I used the company’s pretax cost of debt as the discount rate.
Now that we have this estimate, we can inject these liabilities back into the capital structure to get an adjusted debt-to-equity ratio.
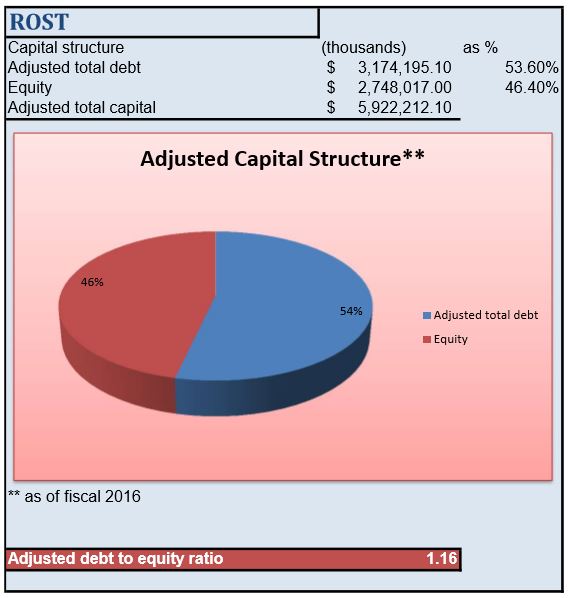
We can see that by capitalizing the leases, the firm’s debt-to-equity ratio jumps to over 1x. This has implications for its ROIC as well.
Adjusting ROIC for off-balance sheet leases…
To gain insight into what effect the newly capitalized leases will have on Ross’ return on invested capital, we need to start by adjusting its net operating profit after tax, or NOPAT (the numerator in the ROIC equation). The first step involves adjusting the firm’s operating profit, or EBIT, first.


Leave A Comment