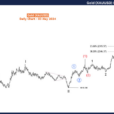
VIX performed an inside consolidation, closing above Long-term support at 10.83 and on a buy signal. The calm may be broken. A breakout above the Ending Diagonal trendline suggests a complete retracement of the decline from January 2016, and possibly to August 2015.
(Bloomberg) Just as the rapper Curtis Jackson III captures attention for realizing he’s made millions on Bitcoin, the buyer of volatility options that shares his moniker is a window shopper in VIX options no longer.
Trading patterns associated with the trader dubbed “50 Cent” resurfaced on Friday as 50,000 March VIX calls with a strike price of 24 were purchased for 49 cents a pop.
SPX completes a “high five.”
SPX extended its Wave (5) above the Ending Diagonal channel in a throw-over formation. A decline beneath its Cycle Top and upper Diagonal trendline at 2739.90 suggests the rally may be over and profits should be taken. A break of the Intermediate-term support at 2655.84 and the trendline nearby, generates a sell signal. Should that happen, we may see a sharp decline in the next two weeks or more.
(CNBC) U.S. stocks closed sharply higher on Friday as quarterly earnings top estimates, while the economy continues to grow.
The Dow Jones industrial average rose 223.92 points and hit intraday and closing records. The 30-stock index finished the session at 26,616.71.
The S&P 500 gained 1.2 percent to 2,872.87, with tech and health care as the best-performing sectors, and also reached an all-time high. The broad index also had its biggest one-day gain since March 1, 2017.
NDX throws over its Channel trendline
The NDX also extended the throw over of its Trading Channel trendline as well. A decline beneath the trendline at 6880.00 suggests that the rally may be over. A further decline beneath lower Diagonal trendline and Intermediate-term support at 6416.90 may produce a sell signal.
(ZeroHedge) Early last month, we showed that one of Bank of America’s “guaranteed bear market” indicators, namely the three-month earnings estimate revision ratio (ERR) which since 1988 has had a 100% hit rate of predicting upcoming bear markets, was just triggered. As ZeroHedge explained at the time, “since 1986, a bear market has followed each time that the ERR rule has been triggered.”
The only weakness of that particular signal is that while a bear market has always followed, the timing was unclear and the bear could arrive as late as two years after its was triggered.
Well, fast forward to today when overnight another proprietary “guaranteed bear market” indicator created by the Bank of America quants was just triggered.
High Yield Bond Index regains momentum
The High Yield Bond rally got a new lease on life as it made new all-time highs this week. It achieved a critical Fibonacci relationship on Friday which may indicate completion. Perhaps a reversal may be in the making? While the trend is still up, a decline beneath the Cycle Top at 195.58 may indicate the rally is over. A sell signal may be generated with a decline beneath the lower Diagonal trendline at 185.00.
(Barrons) The tide of fund flows has turned back in favor of high-yield bonds.
Investors pulled money from U.S. high-yield bond funds for the last 11 weeks of 2017, according to EPFR. This year started off on a brighter note, with January inflows of more than $1 billion. Why the change of heart?
High-yield bonds wobbled late last year as the stock market rallied, which is generally accepted as a sign that a big correction is imminent.


Leave A Comment