Bullish Fundamentals Continue
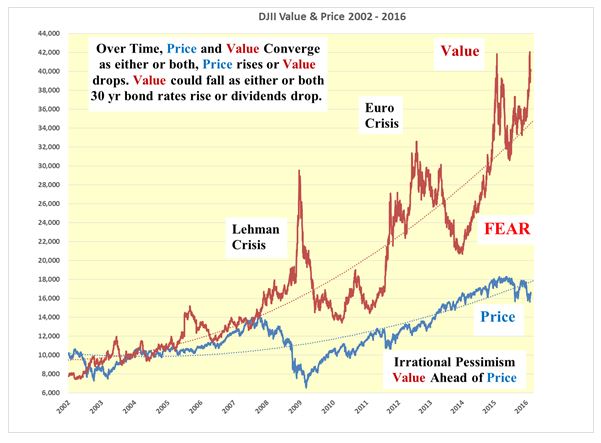
Using the dividend discount model a strong fundamental case has been previously made for there being strong upward pressure on the DJII arising from a low and falling 30 year T Bond rates and rising dividends.
The dividend-discount value of the DJII stands at 40,000 while its price is at 17,000. The upward fundamental pressure on the DJII continues.

Bullish Technical Picture Shaping Up
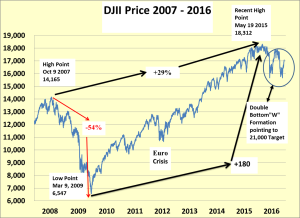
The following chart looks at price alone and while I maintain that it is impossible to predict future prices from past prices there are others who have a different opinion.
Since the peak of the pre-Lehman bull market when the DJII hit 14.165 on October 9, 2007 index rose only 29% to its all-time peak of 18,312 on May 19, 2015. Admittedly, the trajectory was down 54% through 2009 and up from there by 180%.

Since May 2015 the DJII has fallen to approximately 16,000 twice and technicians may well recognise the formation of a double bottom “W” formation. This should lead them to postulate that if the current leg up of the DJII breaks out to new high ground then the “count” should carry the DJII to 21,000 in a relatively short time, possibly this year.
The fundamentals have long been pointing to a substantially higher DJII so I have no argument with a short term move to 21,000 as market participants continue to climb the wall of worry.


Leave A Comment