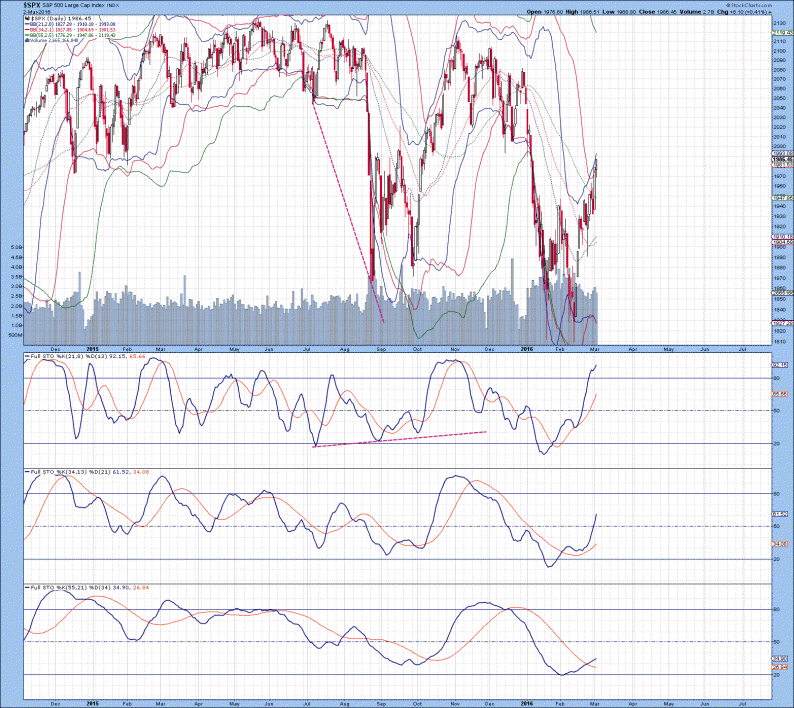
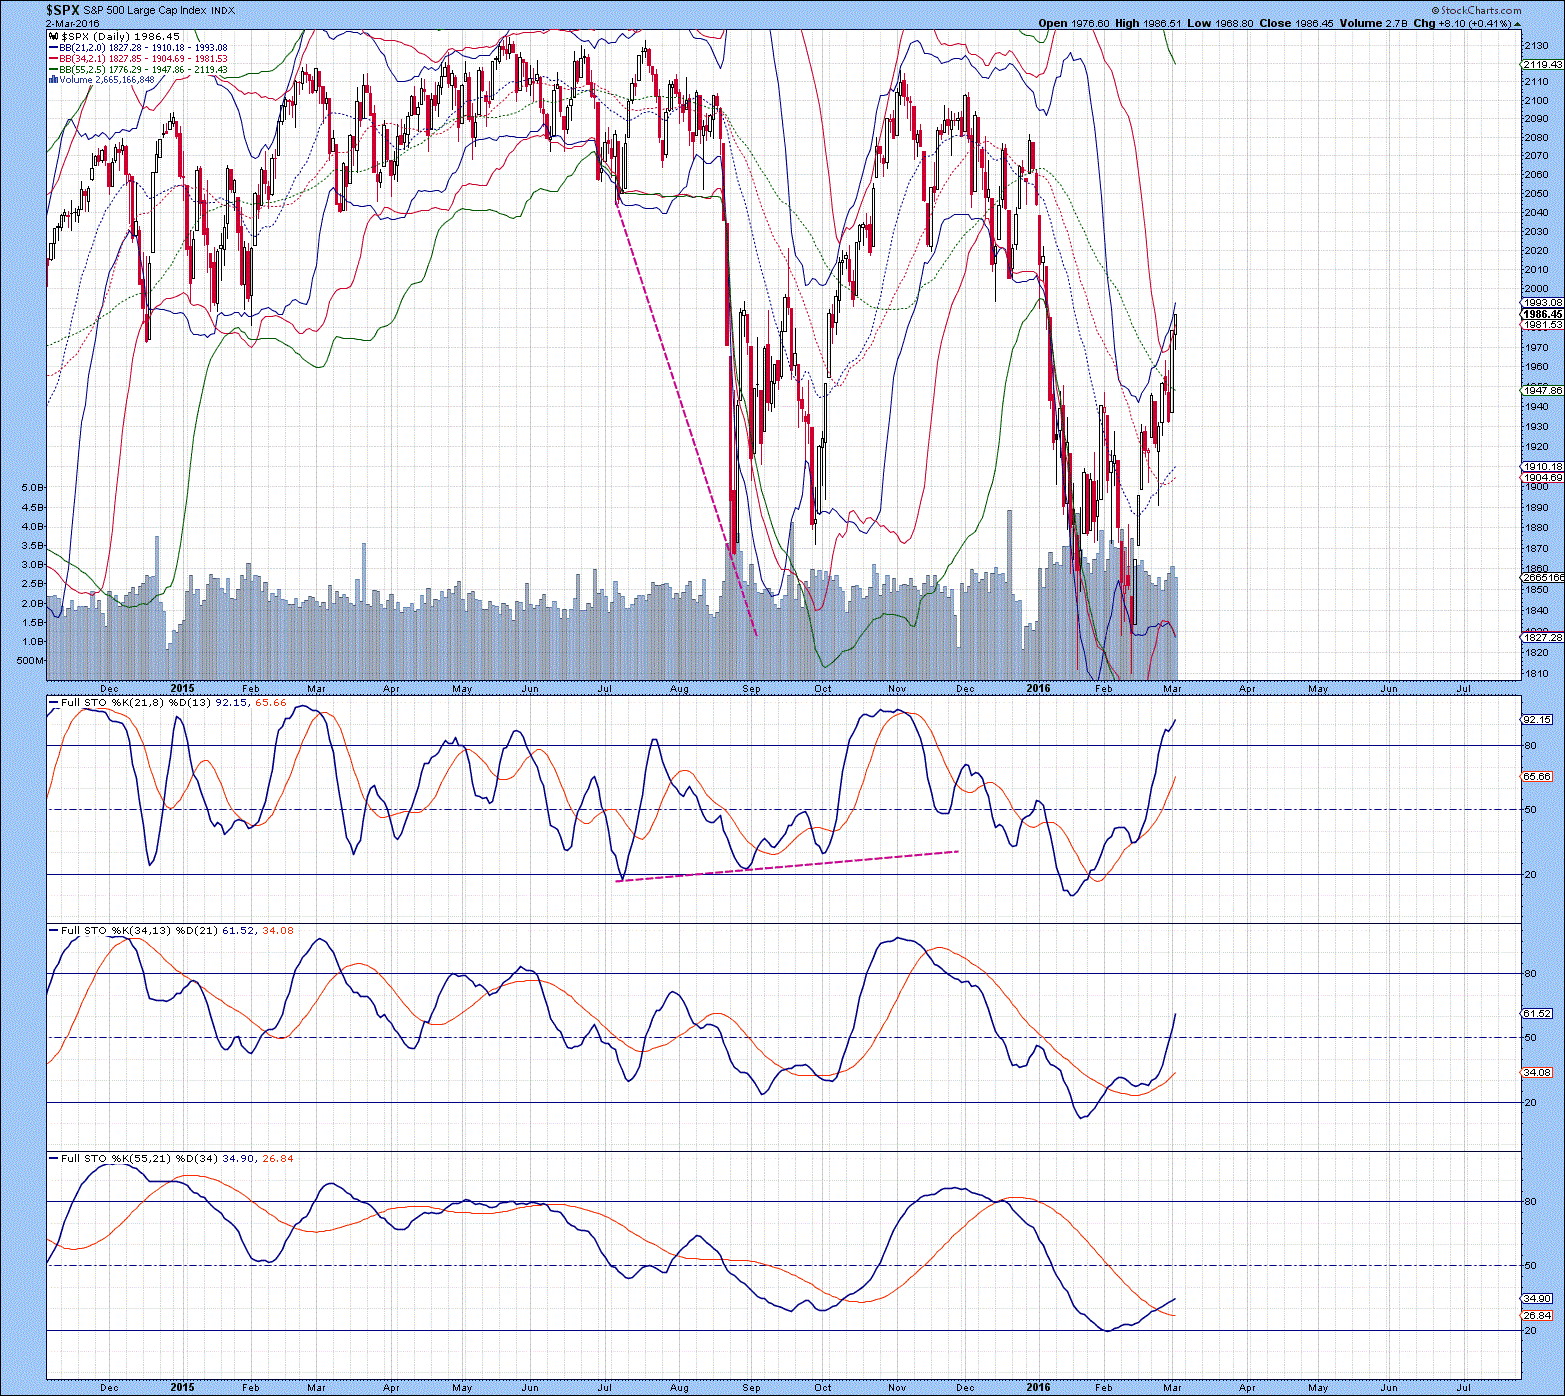
Interesting charts to present today with the S&P 500 Index, which is probably a better market to follow to reflect global economy. As we are all aware, the US Dollar still remains the reserve currency of the US Dollar and with that privilege, it extends into the US stock market. As uncertainties build around the globe, money will look for a home…it may not be the prettiest home, but it is likely the securest.
The daily chart of the S&P 500 Index is shown below, with the upper 21 MA Bollinger Band above the 34 MA Bollinger Band indicates an overbought condition has been generated. Lower 21 and 34 MA Bollinger Bands have curled down, indicating at least another two weeks of sideways to upward priced action before a top is put in place…when both curl up, a top will have been put in place, so this is a very useful metric to follow. There is resistance at 2000, but a move above this and the next major level of support lies between 2070 and 2100. Full stochastics 1, 2 and 3 are shown below in order of descent, with the %K above the %D in all three instances. Positioning of the %K in stochastics 2 and 3 also indicate at least another 2 weeks of upside before any sort of top is put in place.
The weekly chart of the S&P 500 Index is shown below, with Bollinger Bands in their proper order of alignment indicates no overbought or oversold condition has been generated at this point in time. All three lower Bollinger Bands are in close proximity to each other, with stochastics near their low range indicates that the bottom likely has been put in place and upside strength is set to continue forward…if further declines were to occur, we should be seeing that right now but we are not. This observation is very important, as it suggests an accumulation of global funds into the US stock market. Full stochastics 1, 2 and 3 are shown below in order of descent, with the %K beneath the %D in all three instances. The %K in stochastic 1 has curled up, indicating the potential for further upside. With the current trend noted in the daily chart, the bullish upside bias is starting to show contagion in the weekly chart.


Leave A Comment