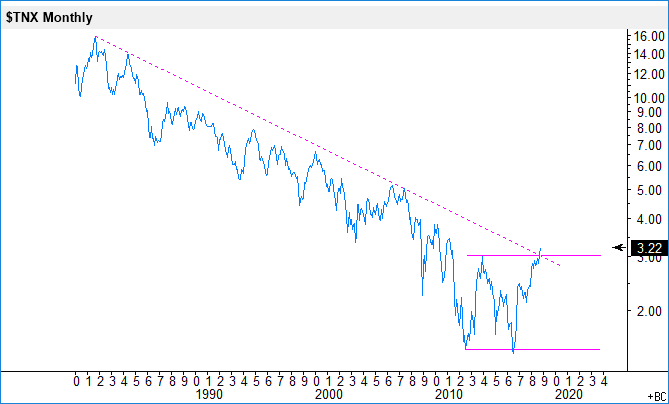
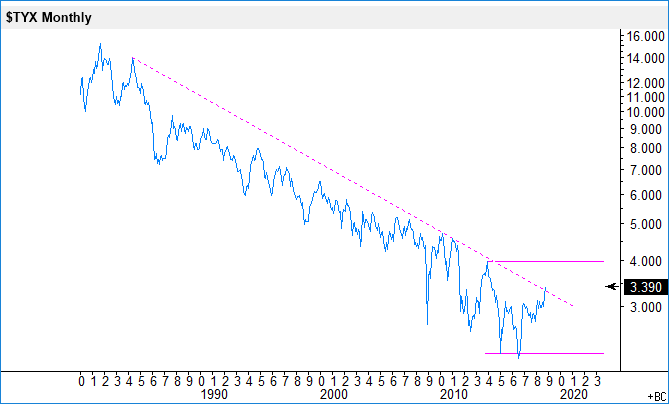
After a steady decline from 1981, US 10-year and 30-year treasury yields found a likely bottom and have been rising since mid-year 2016 – as can be seen in the charts below. The 10-year yield has risen above 3% and is at its highest level since the middle of 2011. Need to see if it can stay there above or if it gets back into the 3.0-1.5% range. Based on the double bottom pattern, the derived longer-term target for the 10-year yield is @ 4.5%.
At bottoms, we often see more volatility and just by looking at the charts we see larger fluctuations in the yields for the last seven years or so. It usually takes some time to build a solid bottom after such a long decline, but the multi-decade bear market in US treasury yields is likely coming to an end.


Leave A Comment