
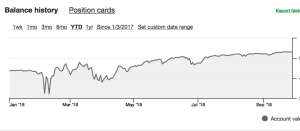
Coming out of a surprisingly strong 3rd Quarter for equities, many fund managers are in “catch-up” mode. The hope is that the 3rd Quarter’s outperformance will be dialed back a little bit and before the height of earnings season commences. As I’ve been offering all year long to Finom Group (for whom I am employed) subscribers, the market should trend higher and express the strength in corporate earnings, derived from the underlying strength in the economy. Additionally, I expected the markets to express a lack of volatility post the February “Volmageddon” period that found the VIX spiking more than 100% in a single day. Based on the plan I had for the Golden Capital Portfolio (for which I manage all investing capital) in 2018, the portfolio is up sharply on the year and since employing a short-VOL strategy that I’m best known for. (See brokerage account balance chart below)
Last week was rather uneventful for the markets, as the week got off to a poor start and attempted a rally post the Fed’s .25 bps rate hike on Wednesday. As investors look forward to the final quarter of the year, let’s briefly summarize the major indices’ performance for the 3rd Quarter. For the quarter, the S&P 500 rose 7.2%, its best quarterly gain since the fourth quarter of 2013. The Nasdaq also notched a 7.1% quarterly gain, its best since first quarter 2017. The Dow Jones Industrial Average outperformed its peers in the third quarter, rising 9.3 percent.
S&P 500 Performance & VIX
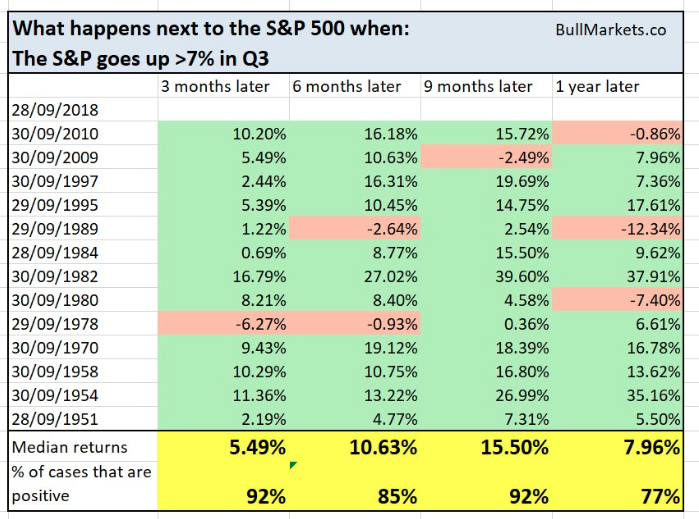
The S&P 500 has risen for 6 straight months, which is historically a bullish signal that forward returns are still yet to come. The following table from Troy Bombardia indicates previous instances whereby the S&P 500 rose greater than 7% in the 3rd Quarter. History does indeed denote continued gains in the forward-looking 12-month period.
With regards to what we could expect from the market this coming week, SPX options depicts an expected weekly move of roughly $34, slightly more than the prior two weeks. Since April 1st, 90% of the time we are seeing the SPX inside of the standard deviation, last week being no exception, having only breached the weekly expected move 3 times since April 1st. As a measure of how things have calmed down of late, the S&P 500 had 36 sessions where it ended with a 1% move in either direction in the first half of the year. So far in the second half, it has had zero.
The S&P 500 has gone 66 trading days without a move of 1% in either direction. “Going back to 1990, only 1993, 1995 and 2017 had longer streaks without a 1% daily change, according to Ryan Detrick of LPL Financial.”

Speaking on the subject of “1% market moves lacking” or volatility, the VIX is a stochastic process that defines a level of complacency or fear at any given moment in the market. The VIX is priced from a portfolio of S&P 500 (SPX) options defined by the CBOE, and the futures price from the market’s expectation (Implied Volatility) of where the VIX Index will settle at expiration. One component in the price of SPX options is an estimate of how volatile the S&P 500 will be between now and the option’s expiration date. As such, VIX is not just a stochastic process that defines volatility, it is a derivative. Furthermore and given the aforementioned characteristics, forecasting and charting the VIX are futile efforts that lack efficacy based on the aforementioned.


Leave A Comment