
The impressive stock market performance of department store operators like Macy’s (M), Nordstrom (JWN), Kohl’s (KSS), J.C. Penney (JCP) and others over the last three trading sessions in the run up to and following their quarterly releases would suggest that market participants are starting to see ‘green shoots’ on the horizon for this beleaguered space.
While there is room for optimism for Kohl’s and J.C. Penney shareholders given their better than expected same-store sales performance, the Macy’s earnings beat doesn’t appear to be anything more than better than expected management execution with respect to expenses and inventories (Macy’s missed same-store sales estimates).
The market’s positive reaction to results from Macy’s and the others isn’t so much reflective of a fundamental reset for these companies, but rather a function of the extremely bearish sentiment on these names. For example, despite the roughly +7% pop in Macy’s shares over the last three sessions, the stock is down -44% this year, underperforming the Zacks Department Store industry’s -36.1% drop and the S&P 500 index’s +15.9% gain. There is a buyer for every stock at the ‘right price’ and the prices for Macy’s and others likely had overshot to the downside.
The broader retail sector, however, has done really well this year; in fact the sector has done better than the S&P 500 index. The Zacks Retail sector is up +22.1% in the year-to-date period, doing better than the broader market. The broader sector’s outperformance primarily reflects the reality that the Zacks Retail sector not only houses the likes of Macy’s and other brick-and-mortar operators, but also online vendors like Amazon (AMZN) that are behind the traditional operators’ never-ending pain.
You can clearly see this dynamic at play in the year-to-date chart below plotting Macy’s (red line) against the Zacks Department Store industry (blue line) and Amazon (green line).
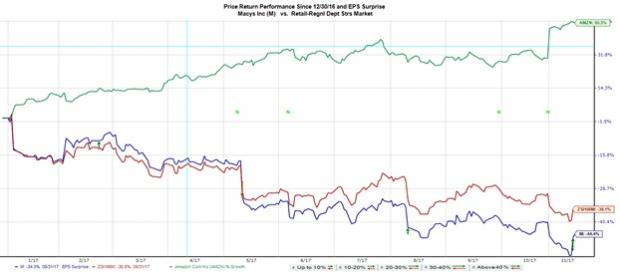
The issues are well known by now – these operators needed literally to reinvent their businesses to effectively operate in an environment where consumers are steadily shifting their spending dollars to the online medium instead of visiting the physical store. This obviously isn’t just a 2017 phenomenon and has been around for a while now, but we get to see an interesting dynamic at play if we look at the same chart on a longer time horizon, say 5 years, as in the chart below.

What is interesting about this longer time horizon chart is that Macy’s, the department store space as a whole and Amazon shares are roughly moving in-line with each other for quite a while, through July 17, 2015 to be precise. In other words, what seem such obvious existential secular headwinds facing this space at present are only so with the benefit of hindsight; the market had no idea what lay ahead for Macy’s and its peers prior to that July day in 2015. The takeaway from this discussion is that many trends that appear crystal clear in retrospect are anything but that in real time.
What’s the significance of that date in July 2015? Amazon held its first Prime Day on July 15th to celebrate the 20th anniversary of its founding, which it claimed turned out to be bigger than Black Friday. As you can see in the chart above, the world has never been the same since that day, particularly for Macy’s and its department store peers.
Retail Sector Scorecard
As of Friday, November 10th, we now have Q3 results from 22 of the 39 retailers in the S&P 500 index. This week brings results from the big-box operators Wal-Mart (WMT), Target (TGT), Home Depot (HD) and others. Total earnings for the 22 retailers that have reported already are up +2.3% from the same period last year on +10.1% higher revenues, with 81.8% beating EPS estimates and 63.6% beating revenue estimates.
Please note that we have a stand-alone Retail sector, unlike the official Standard & Poor’s placement of this space in their Consumer Discretionary sector. The Zacks Retail sector includes, besides the traditional department stores and other brick-and-mortar retailers, the online vendors like Amazon and Priceline and restaurant operators. Results from the online vendors and most of the restaurant operators are already behind us at this stage.
The side-by-side charts below compare the sector’s results thus far with what we have seen from the same group of 22 retailers in other recent periods.
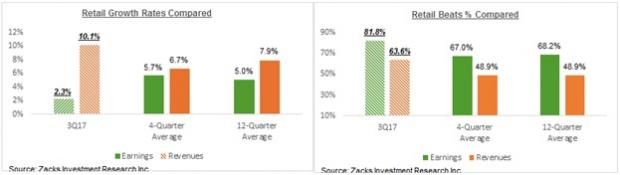
The aggregate earnings growth pace from the 22 retailers that have reported results already are tracking below what we had seen from the same companies in other recent periods, though revenue growth is notably above other recent periods. Positive surprises are as numerous in this sector as they have been all along in other sectors this earnings season.
A big driver of the top-line growth momentum is Amazon whose Q3 revenues were up +33.7% from the year-earlier period. As you can see in the growth comparison charts below, the sector’s reported Q3 revenue growth halves on an ex-Amazon basis (right-hand side chart).

We will get Retail’s complete picture following this week’s results from Wal-Mart, Target, Home Depot and others.
Q3 Earnings Season Scorecard (as of Friday, November 10, 2017)
We now have Q3 results from 457 S&P 500 members or 91.4% of the index’s total membership. Total earnings for these companies are up +6.7% from the same period last year on +6.1% higher revenues, with 72.6% beating EPS estimates and 66.5% beating revenue estimates.
The charts below compare the Q3 results thus far from the 457 index members with what we had seen from the same group of companies in other recent periods.


Leave A Comment