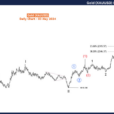
At 11:30 AM this morning August natural gas prices were down a little over 1% after breaking through support on large volume around 8 AM. Since then, prices have attempted to break back above that support in the $2.69-$2.70 range, finally making it through on a surge of buying just before noon. Though price movements on a weekly basis have been relatively small, this level appears critical to determining whether the uptrend of the last couple months continues or whether at least one more leg lower in prices should be expected in the coming weeks. As seen below, the August contract has bounced off its 30-day moving average each of the last 3 days, and thus far today a recent surge of buying has appeared to bring us right back over that level (as of 12PM the August contract was trading at $2.725).

A couple things can become apparent on this chart. First, we observed that back in November the August contract bounced perfectly off of $2.70; that level was resistance in mid-June, turned into support once we broke through it, and then has been providing support through the month of July. A close under $2.70 would be the first since mid June, and a close below the 30-day moving average would be the first since late May, when the initial natural gas rally began.
Additionally, a number of natural gas traders have been looking at the potential head-and-shoulders formation here (initial high in mid-June, higher high on July 1st, then lower high on July 8th before a reversal lower). This would seem to indicate that any break of the neck-line around $2.70 would portend a more significant move lower as well.
Should the August contract break support and head lower, we see the 50-day moving average lingering all the way down near $2.55. Back in June, we saw strong support at $2.60 that prices stabilized prices before the next leg up that we also monitored. Meanwhile, should this rally continue into the close with yet another settle above $2.70, we would look at lingering resistance around $2.78, where the 20-day moving average sits which provided some temporary support last week. Given the current supply/demand landscape, which we have written about this week, and the already bullish weather forecasts that the market has appeared to digest, it would be difficult to see a short-term move above this support, especially as prices are still struggling to move above the $2.70 level, but there appears resistance near $2.82 (10-day moving average) and $2.87 (the July 8th high).


Leave A Comment