This past weekend, I did not write a weekly newsletter as I was traveling for the Easter holiday. Therefore, before I get to the “Dollar Paradox,” let’s take a look at the technical backdrop from last week to identify any important short-term changes to the overall outlook.
As I noted then:
“While my “emotions” are currently screaming to start increasing equity allocations at this juncture, there are several reasons why my discipline is keeping me from doing so currently:
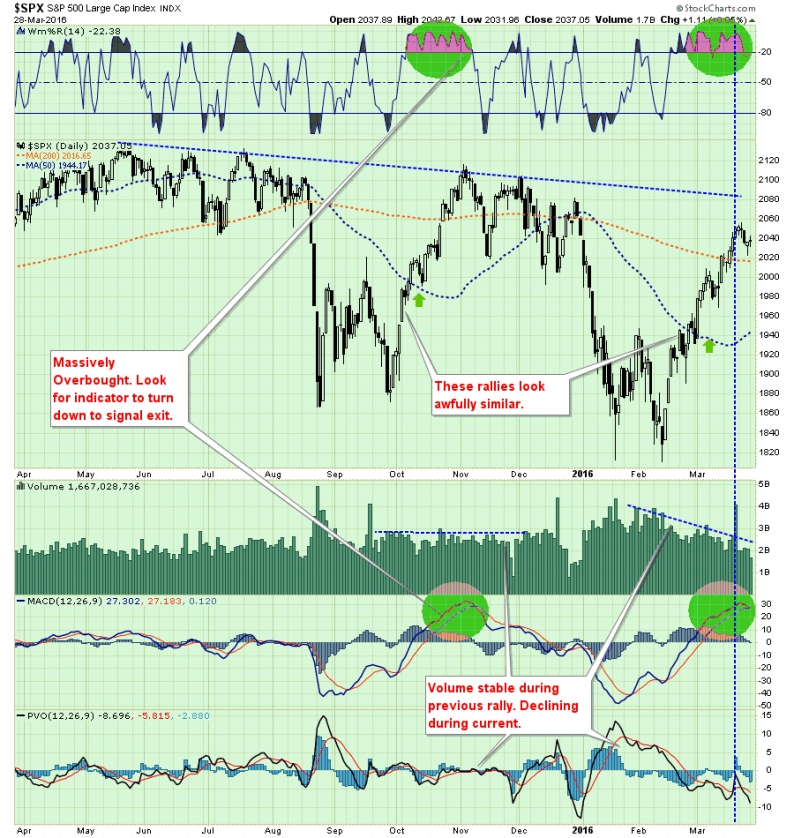
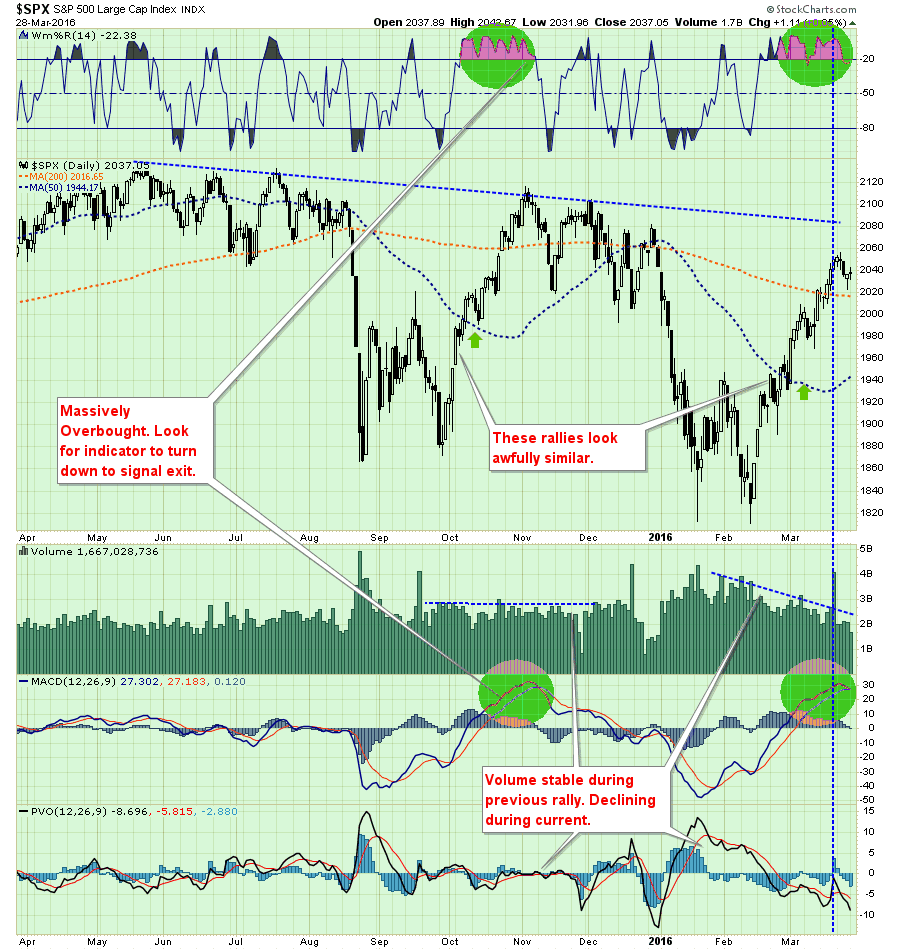
- The market is GROSSLY overbought in the short-term and will have either a mild corrective process or consolidation to allow for an increase in equity exposure.
- Negative trends are still in place which suggests the current rally, while significant, remains within the context of a reflexive rally.
- Volume is declining on the rally suggesting a lack of conviction.
- This rally looks very similar to the rally last October except the fundamentals are substantially weaker.”
Has anything changed?
The short answer is “No.”
However, it is worth noting that the two indicators (green highlighted circles) are extremely close to turning down just as they did last November which signaled the end of the bullish reversal at that time.
Despite the very sharp “March rally,” there is little evidence that the “bullish trend” has been re-established at this point. We can view this more clearly by stepping back and viewing a longer-term (monthly) chart of the market.
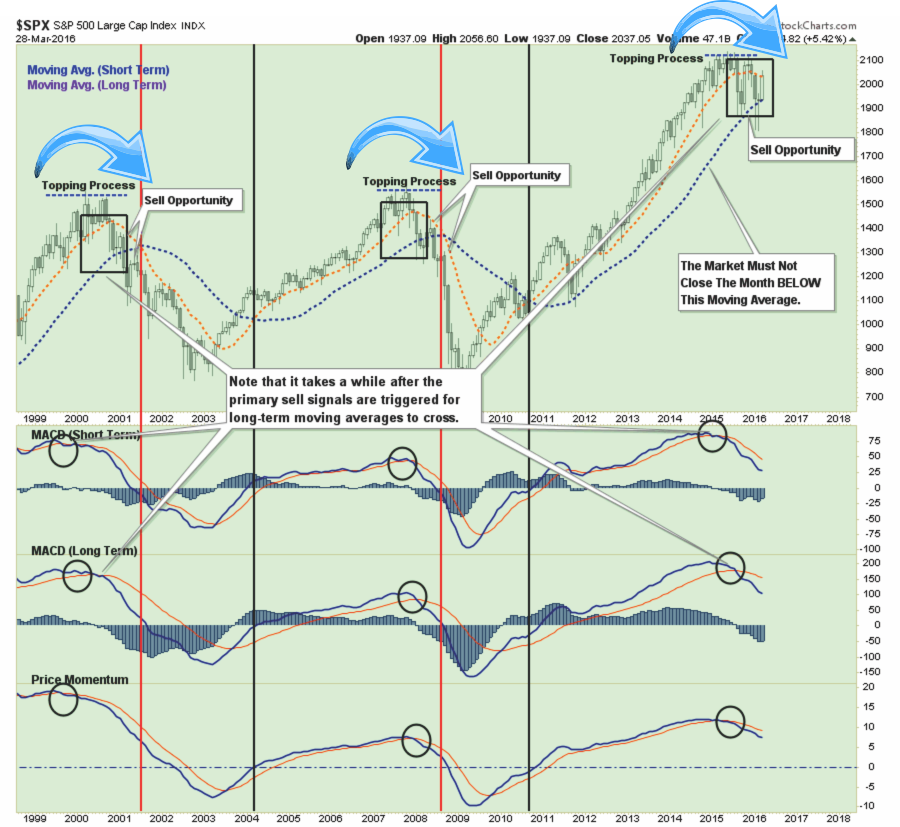
As shown in both charts above, on both a short and long-term basis, the market continues to exhibit more “bearish”than “bullish” behavior…for now. The recent rally, while strong in terms of price movement, was driven primarily by a massive liquidation of short positions. However, with a bulk of that “fuel” now depleted, economic and fundamental data still very weak, and the majority of Central Bank actions now behind us, there is little impetus at the moment for higher equity prices.


Leave A Comment