The blowout Apple (AAPL) report became the latest earnings release that built on the momentum we have been seeing from a diverse cross-section of companies this earnings season. The trend is particularly notable in the Technology sector, where not only the likes of Facebook (FB) and Google (GOOGL) are shining, but even stodgier operators like Microsoft (MSFT) and Intel (INTC) appear to have recaptured their mojo.
The law of large numbers doesn’t appear to have the same meaning for these Tech companies as it does for leaders in other sectors. After all, Apple’s +18.9% higher earnings in Q3 on +12.2% higher revenues are on a base of more than $9 billion in earnings and $46.9 billion in revenues in the year-earlier quarter. Importantly, Apple showed again that while iPhone may account for a bigger chunk of its business, it is by no means that only driver, as the +24% jump in the high-margin services revenue to $7.9 billion shows.
All in all, it has been an impressive earnings performance from the Technology sector, which should help ease concerns about the sector’s strong performance lately (the Zacks Tech sector is up +25.9% year-to-date vs. +15.3% gain for the S&P 500 and +6.2% gain for the Russell 2000).
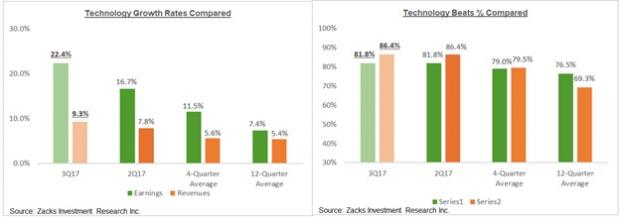
For the Tech sector, we now have Q3 results from 85% of the sector’s market cap in the S&P 500 index. Total earnings for these Tech companies are up +22.4% from the same period last year on +9.3% higher revenues, with 81.8% beating EPS estimates and 86.4% beating revenue estimates.
As high as the proportion of Tech companies beating estimates is, the beats percentages are actually in-line with other recent quarters. But growth is notably accelerating, as the comparison charts below show.

Q3 Earnings Season Scorecard (as of Friday, November 3, 2017)
We now have Q3 results from 406 S&P 500 members that combined account for 85.4% of the index’s total market capitalization. Total earnings for these companies are up +7.5% from the same period last year on +6.3% higher revenues, with 73.9% beating EPS estimates and 66.7% beating revenue estimates.
The charts below compare the Q3 results thus far from the 406 index members with what we had seen from the same group of companies in other recent periods.


Leave A Comment